本文為英文版的機器翻譯版本,如內容有任何歧義或不一致之處,概以英文版為準。
使用自然語言提示產生分析
使用 Quick Sight,您可以從自然語言提示產生多工作表分析。描述您想要的分析,Quick Sight 會建立多個組織工作表,其中包含視覺效果、篩選條件控制和計算欄位,例如year-over-year成長和month-over-month比較。
在產生開始之前,您可以檢閱和修改概述提議結構的互動式計劃。
產生的輸出是原生 Quick Sight 分析。它適用於現有的發佈工作流程、內嵌模式、CI/CD 管道,以及分析表面的point-and-click式編輯。產生後,您可以精簡每個視覺效果。
先決條件
若要從自然語言提示產生分析,您需要下列項目:
-
AWS 帳戶
-
具有至少一個 Author Pro 使用者的 Amazon Quick Enterprise Edition
-
您的 Quick Sight 帳戶中至少有一個資料集
產生分析
使用下列程序從自然語言提示產生分析。
從自然語言提示產生分析
-
執行以下任意一項:
-
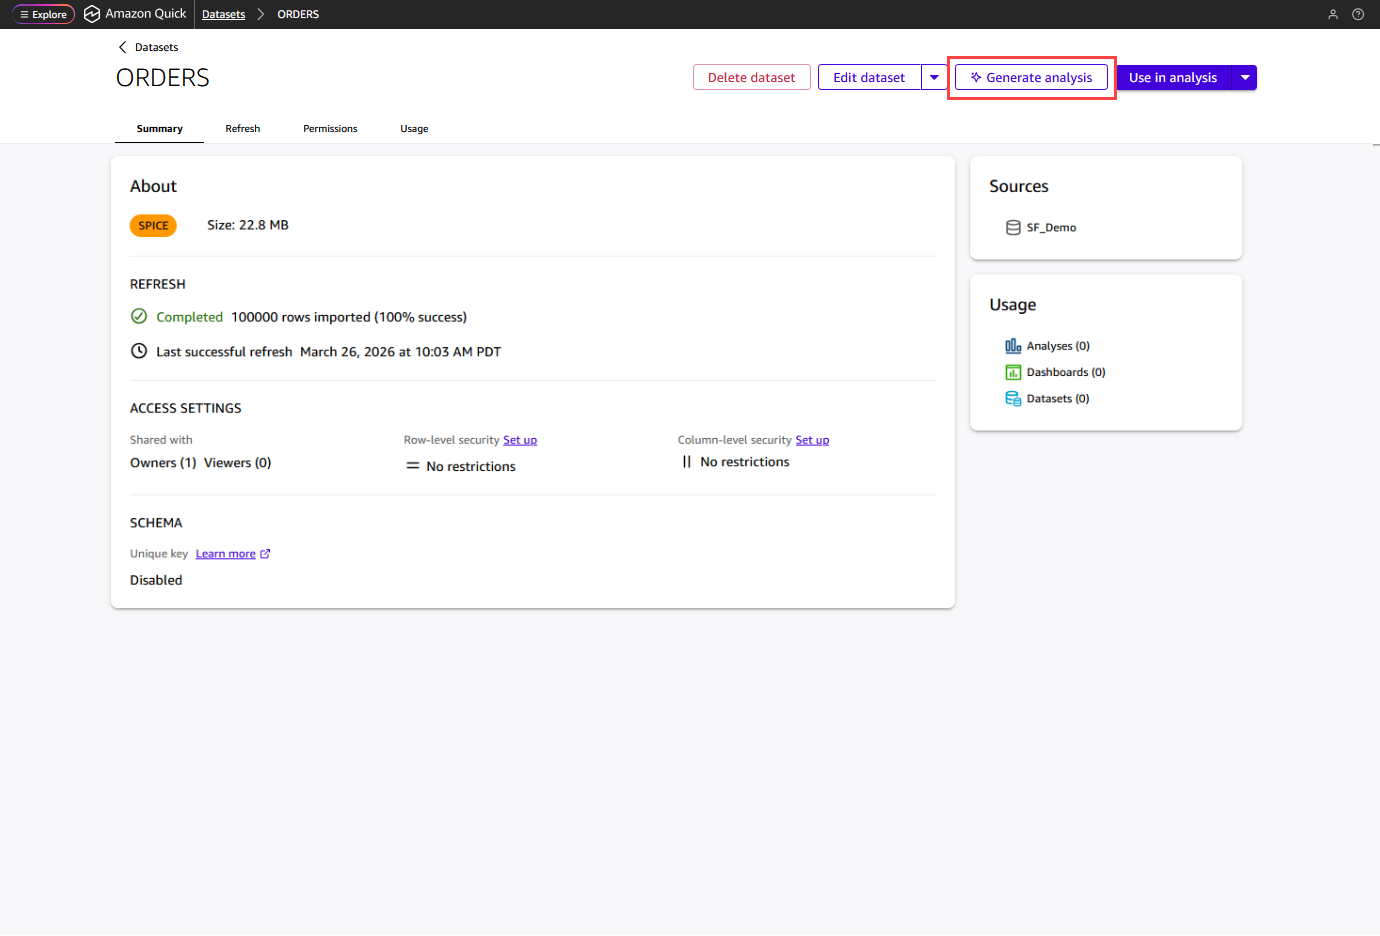
開啟資料集,然後選擇產生分析。
-
在分析頁面中,選擇產生分析。
-
-
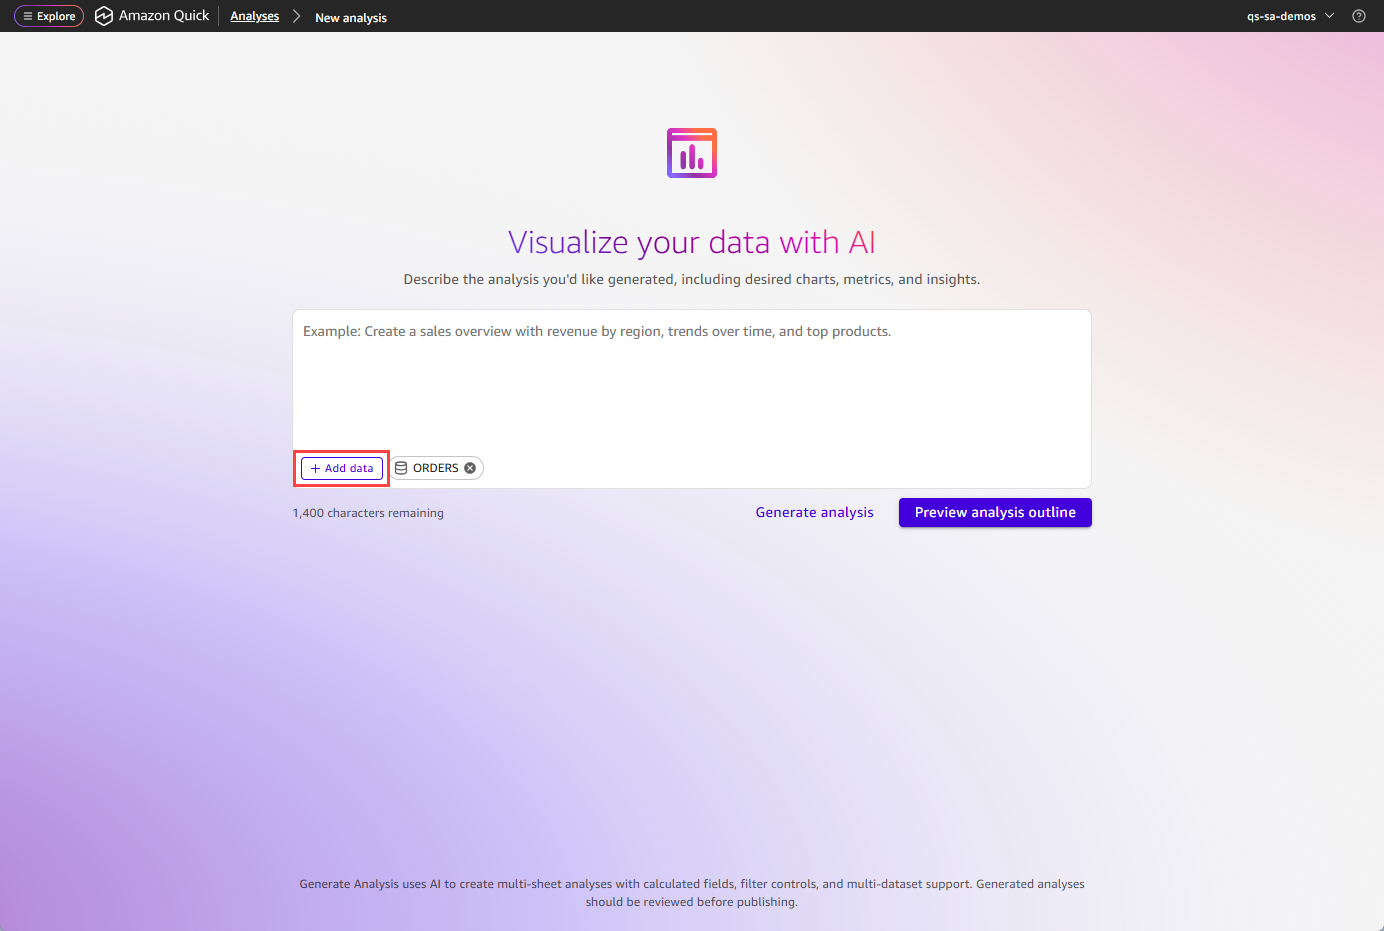
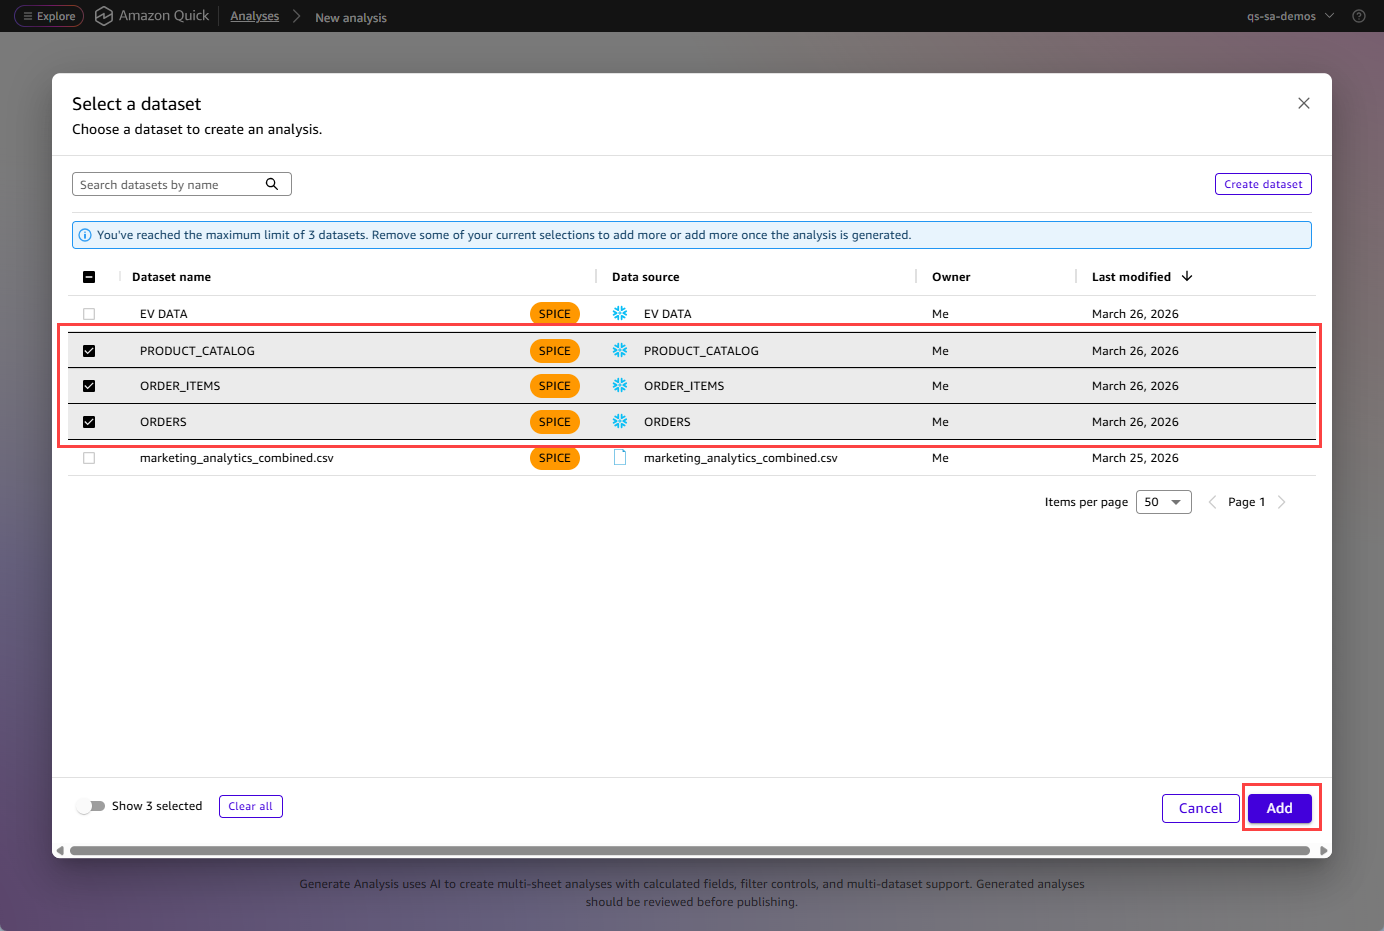
選擇新增資料,為分析選取一到三個資料集。如果您的資料跨越多個資料表 (例如,一個資料集中的訂單和另一個資料集中的產品),您可以一起選取它們。
-
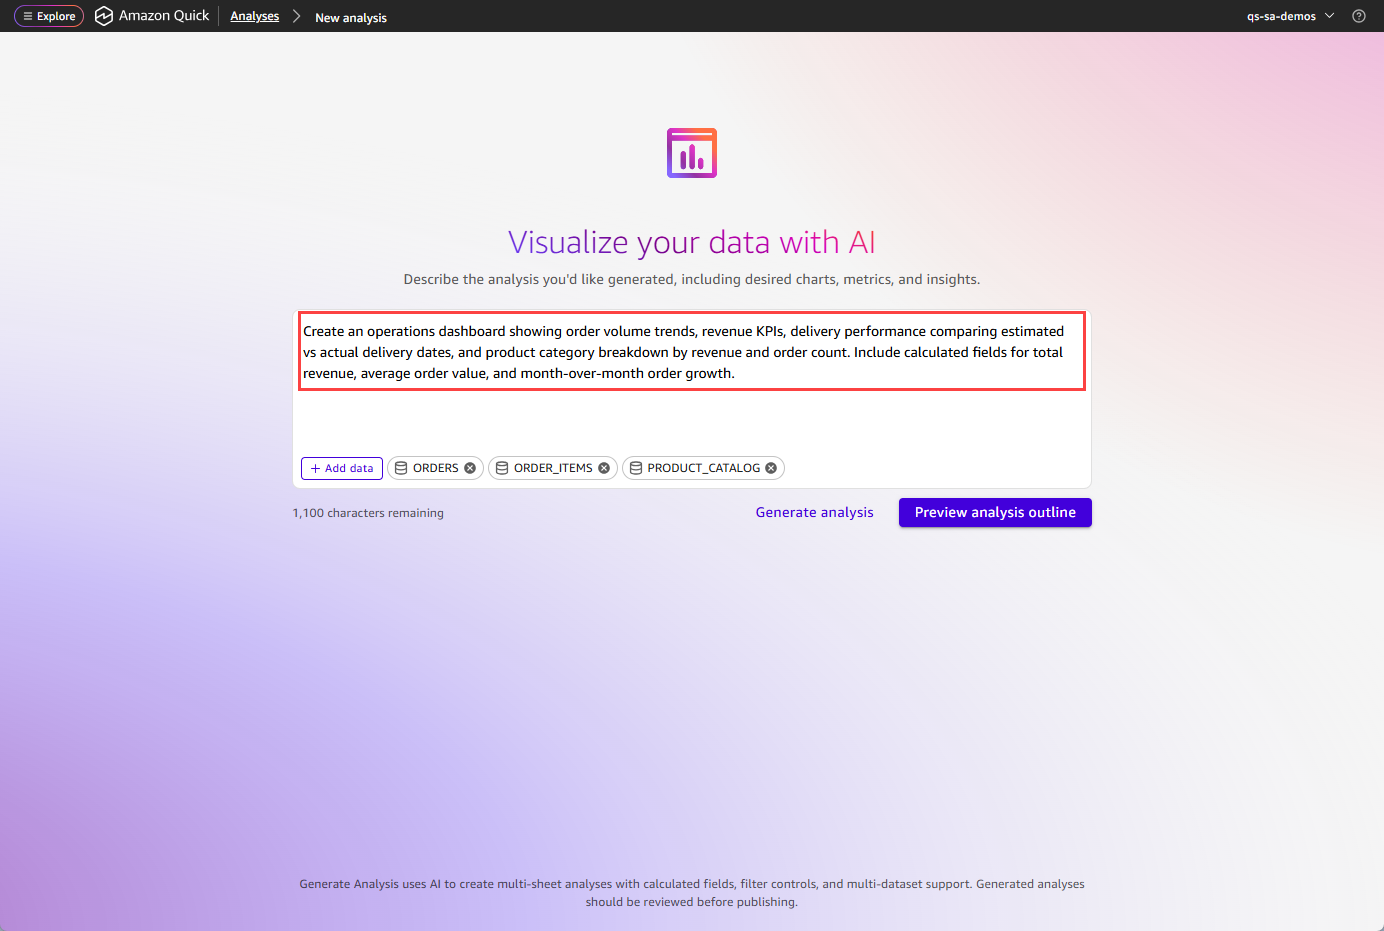
輸入描述您要建立之分析的自然語言提示。您可以描述您想要回答的業務問題、您關心的指標,以及您希望資訊如何組織在工作表中。
範例提示:
「建立操作儀表板,顯示訂單量趨勢、營收 KPIs、比較預估與實際交付日期的交付效能,以及依營收和訂單計數分類的產品類別明細。包含總營收、平均訂單值和month-over-month訂單成長的計算欄位。」
-
執行以下任意一項:
-
選擇產生分析以立即開始產生。
-
選擇預覽分析大綱,先檢閱大綱。
-
-
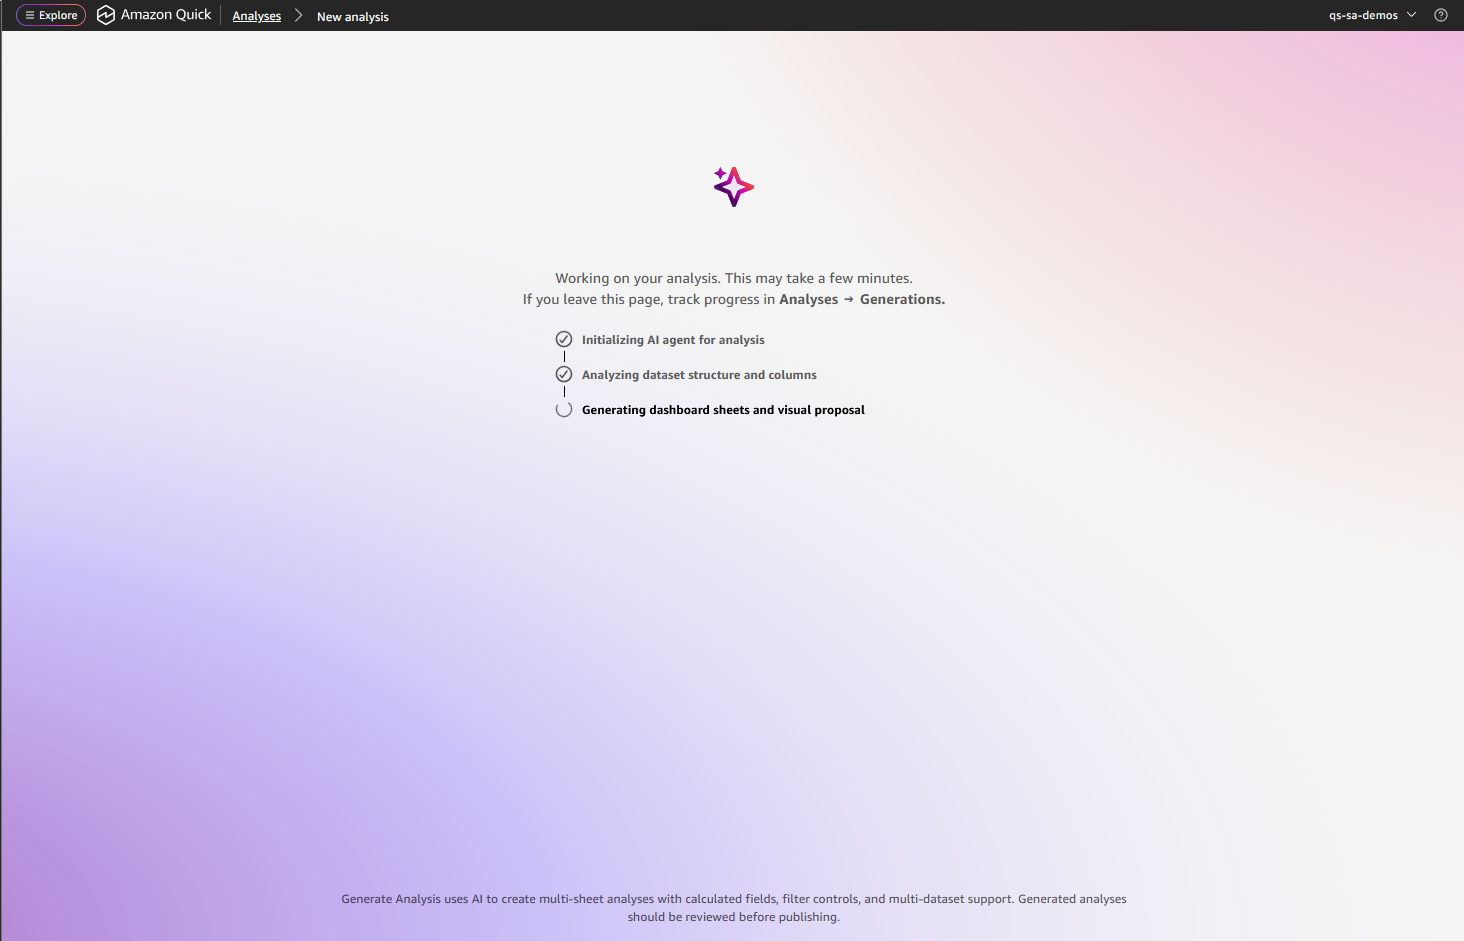
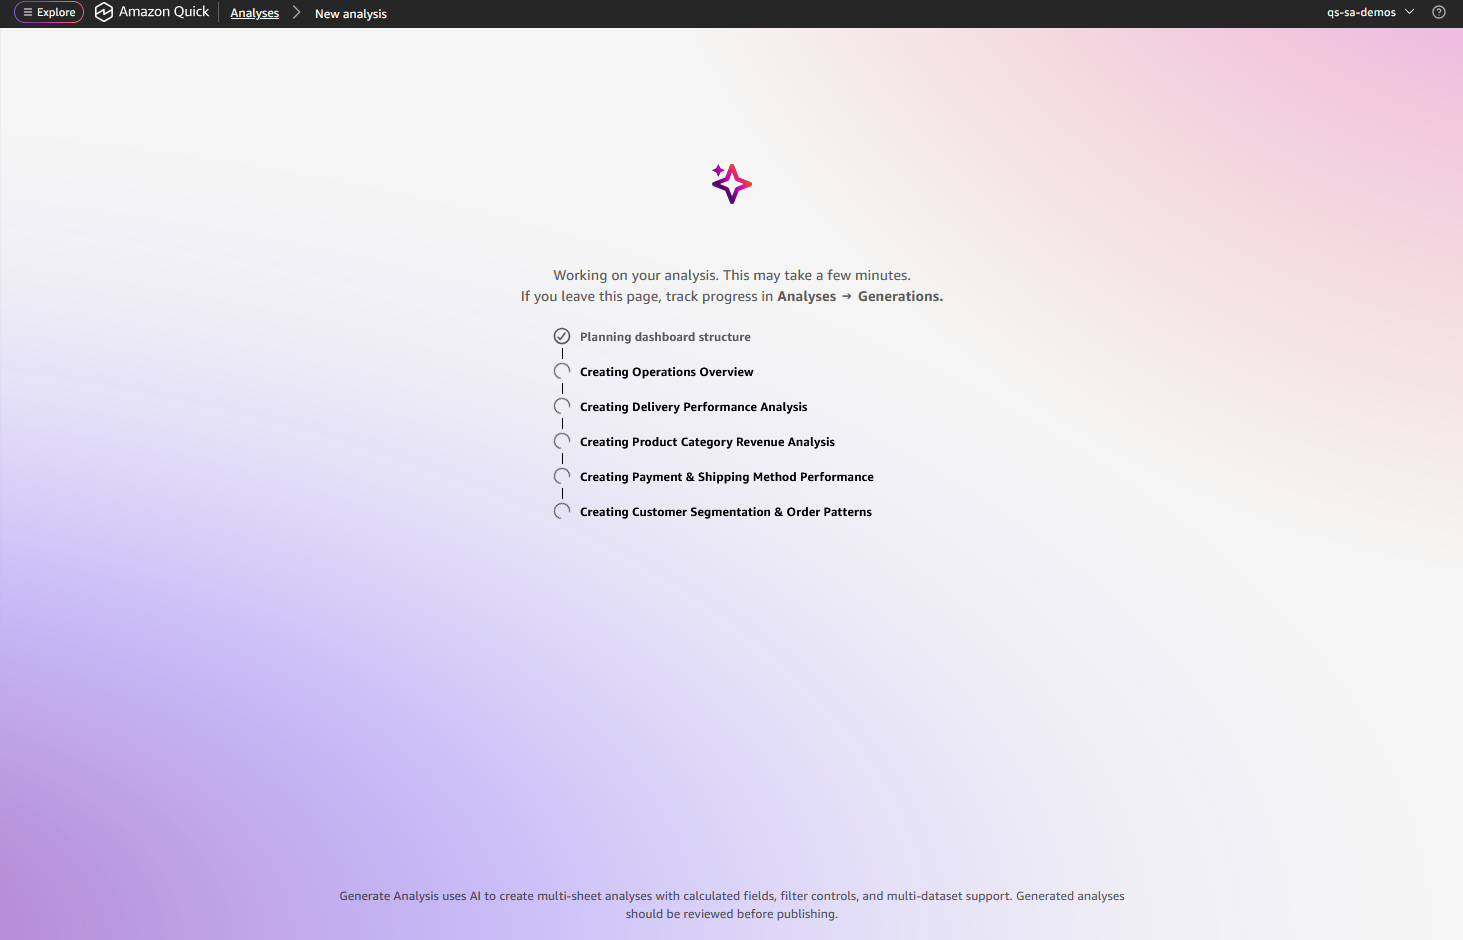
等待 Quick Sight 分析您的資料集結構和資料欄統計資料。即時進度更新會顯示目前狀態。
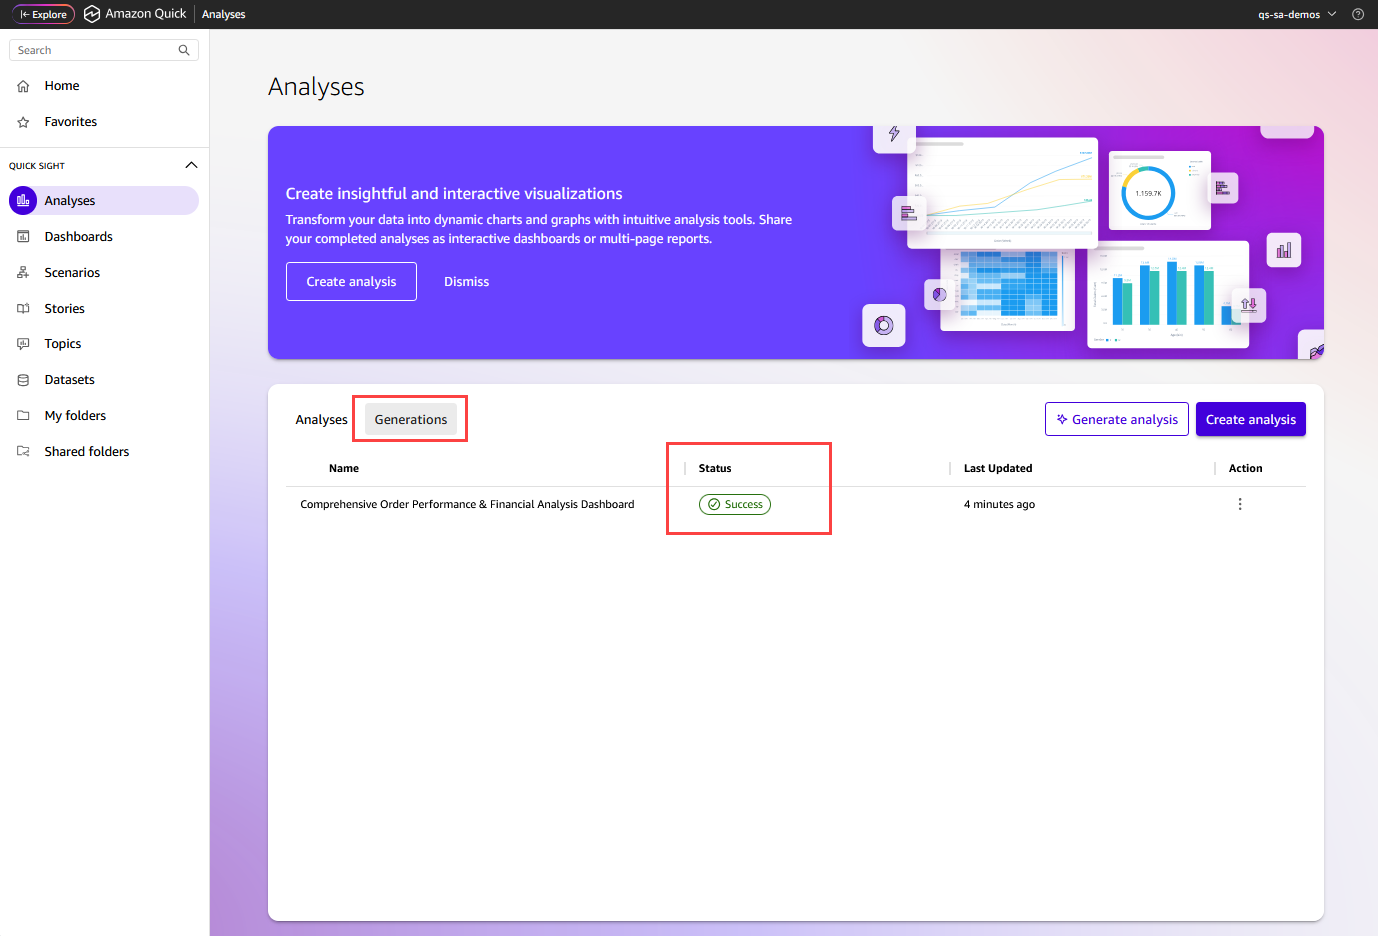
注意
如果您離開進度畫面,您可以選擇產生索引標籤,在分析頁面上檢查產生狀態。選擇要返回進度畫面的產生名稱。
-
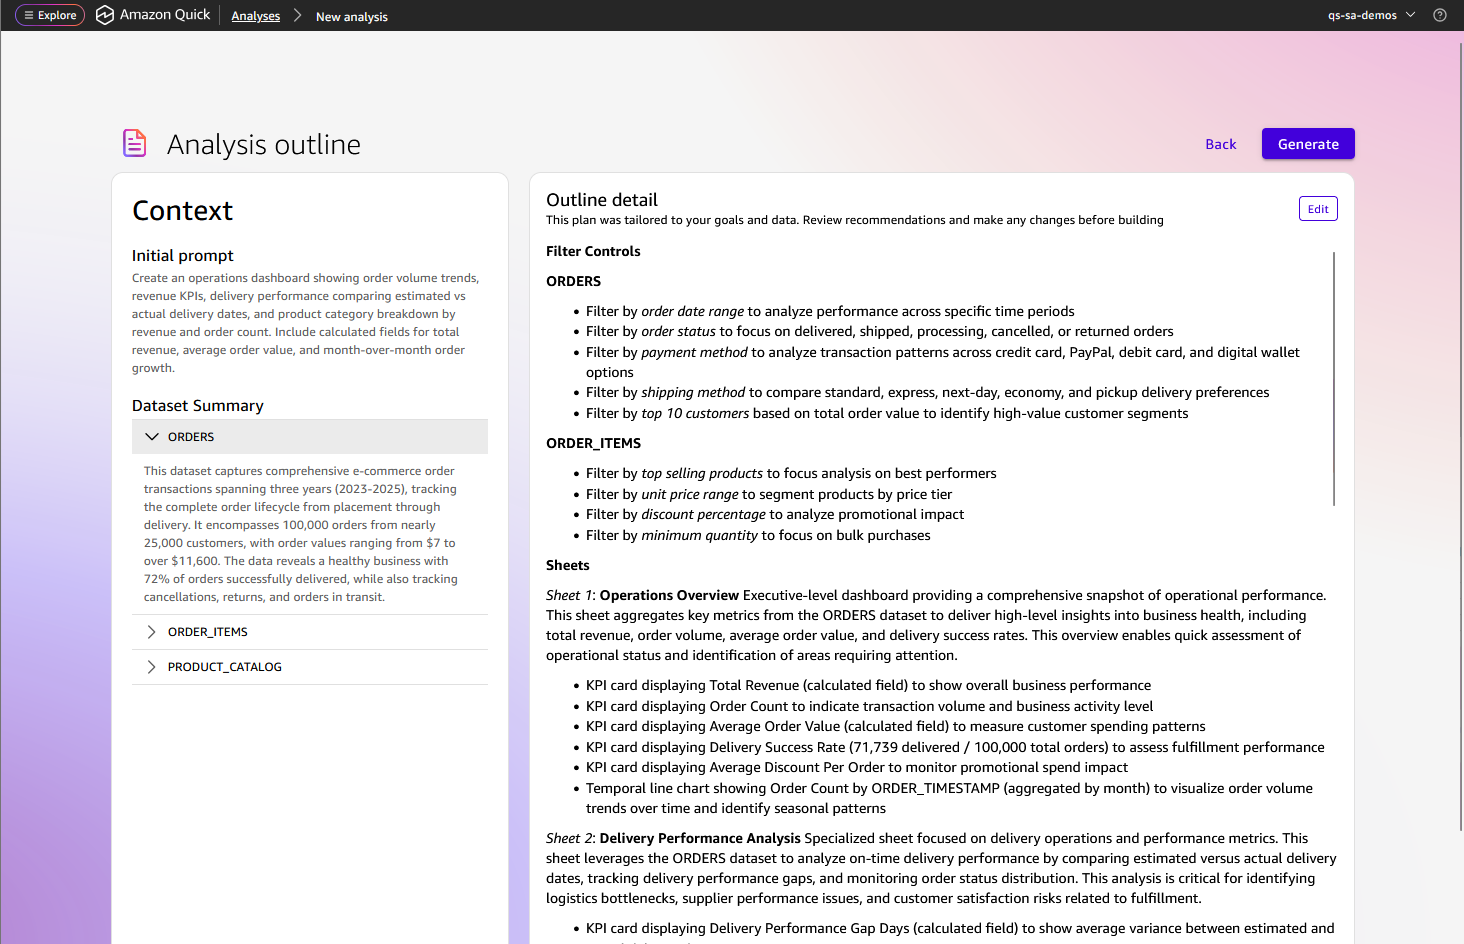
Quick Sight 提供雙窗格檢視:
-
左側窗格會顯示您的初始提示和所選資料集的摘要。
-
右窗格顯示針對每個工作表規劃的提議篩選條件控制項、工作表和視覺效果。
您可以編輯工作表名稱、新增或移除視覺效果、調整計劃,並在產生之前精簡提示。
-
-
選擇 Generate (產生)。即時進度更新會顯示目前狀態。產生需要 2 到 5 分鐘,取決於工作表和視覺效果的數量。

發佈產生的分析
對產生的分析感到滿意後,請選擇發佈以建立儀表板。
您可以與其他使用者共用儀表板、將其內嵌在應用程式中,或排程電子郵件傳遞。如需發佈和共用的詳細資訊,請參閱 發布儀表板和 共用 Quick Sight 分析。