協助改進此頁面
本文為英文版的機器翻譯版本,如內容有任何歧義或不一致之處,概以英文版為準。
若要為本使用者指南貢獻內容,請點選每個頁面右側面板中的在 GitHub 上編輯此頁面連結。
本文為英文版的機器翻譯版本,如內容有任何歧義或不一致之處,概以英文版為準。
使用 CLIs 為 AI/ML 工作負載設定 Amazon EKS 叢集
提示
註冊
本節將逐步引導您建立透過 CLI 命令在 Amazon EKS 上執行訓練或推論工作負載所需的基礎設施。這些步驟包括建立 EKS 叢集、使用 EKS Auto Mode 或 Karpenter 啟用 GPU 的節點、使用 Prometheus 和 Grafana 的監控堆疊,以及用於模型權重的 Amazon S3 儲存。
如需這些功能如何在 EKS 叢集中佈建和自動擴展 EC2 執行個體的詳細資訊,請參閱 EKS Auto Mode 和 Karpenter
高階架構和工作流程
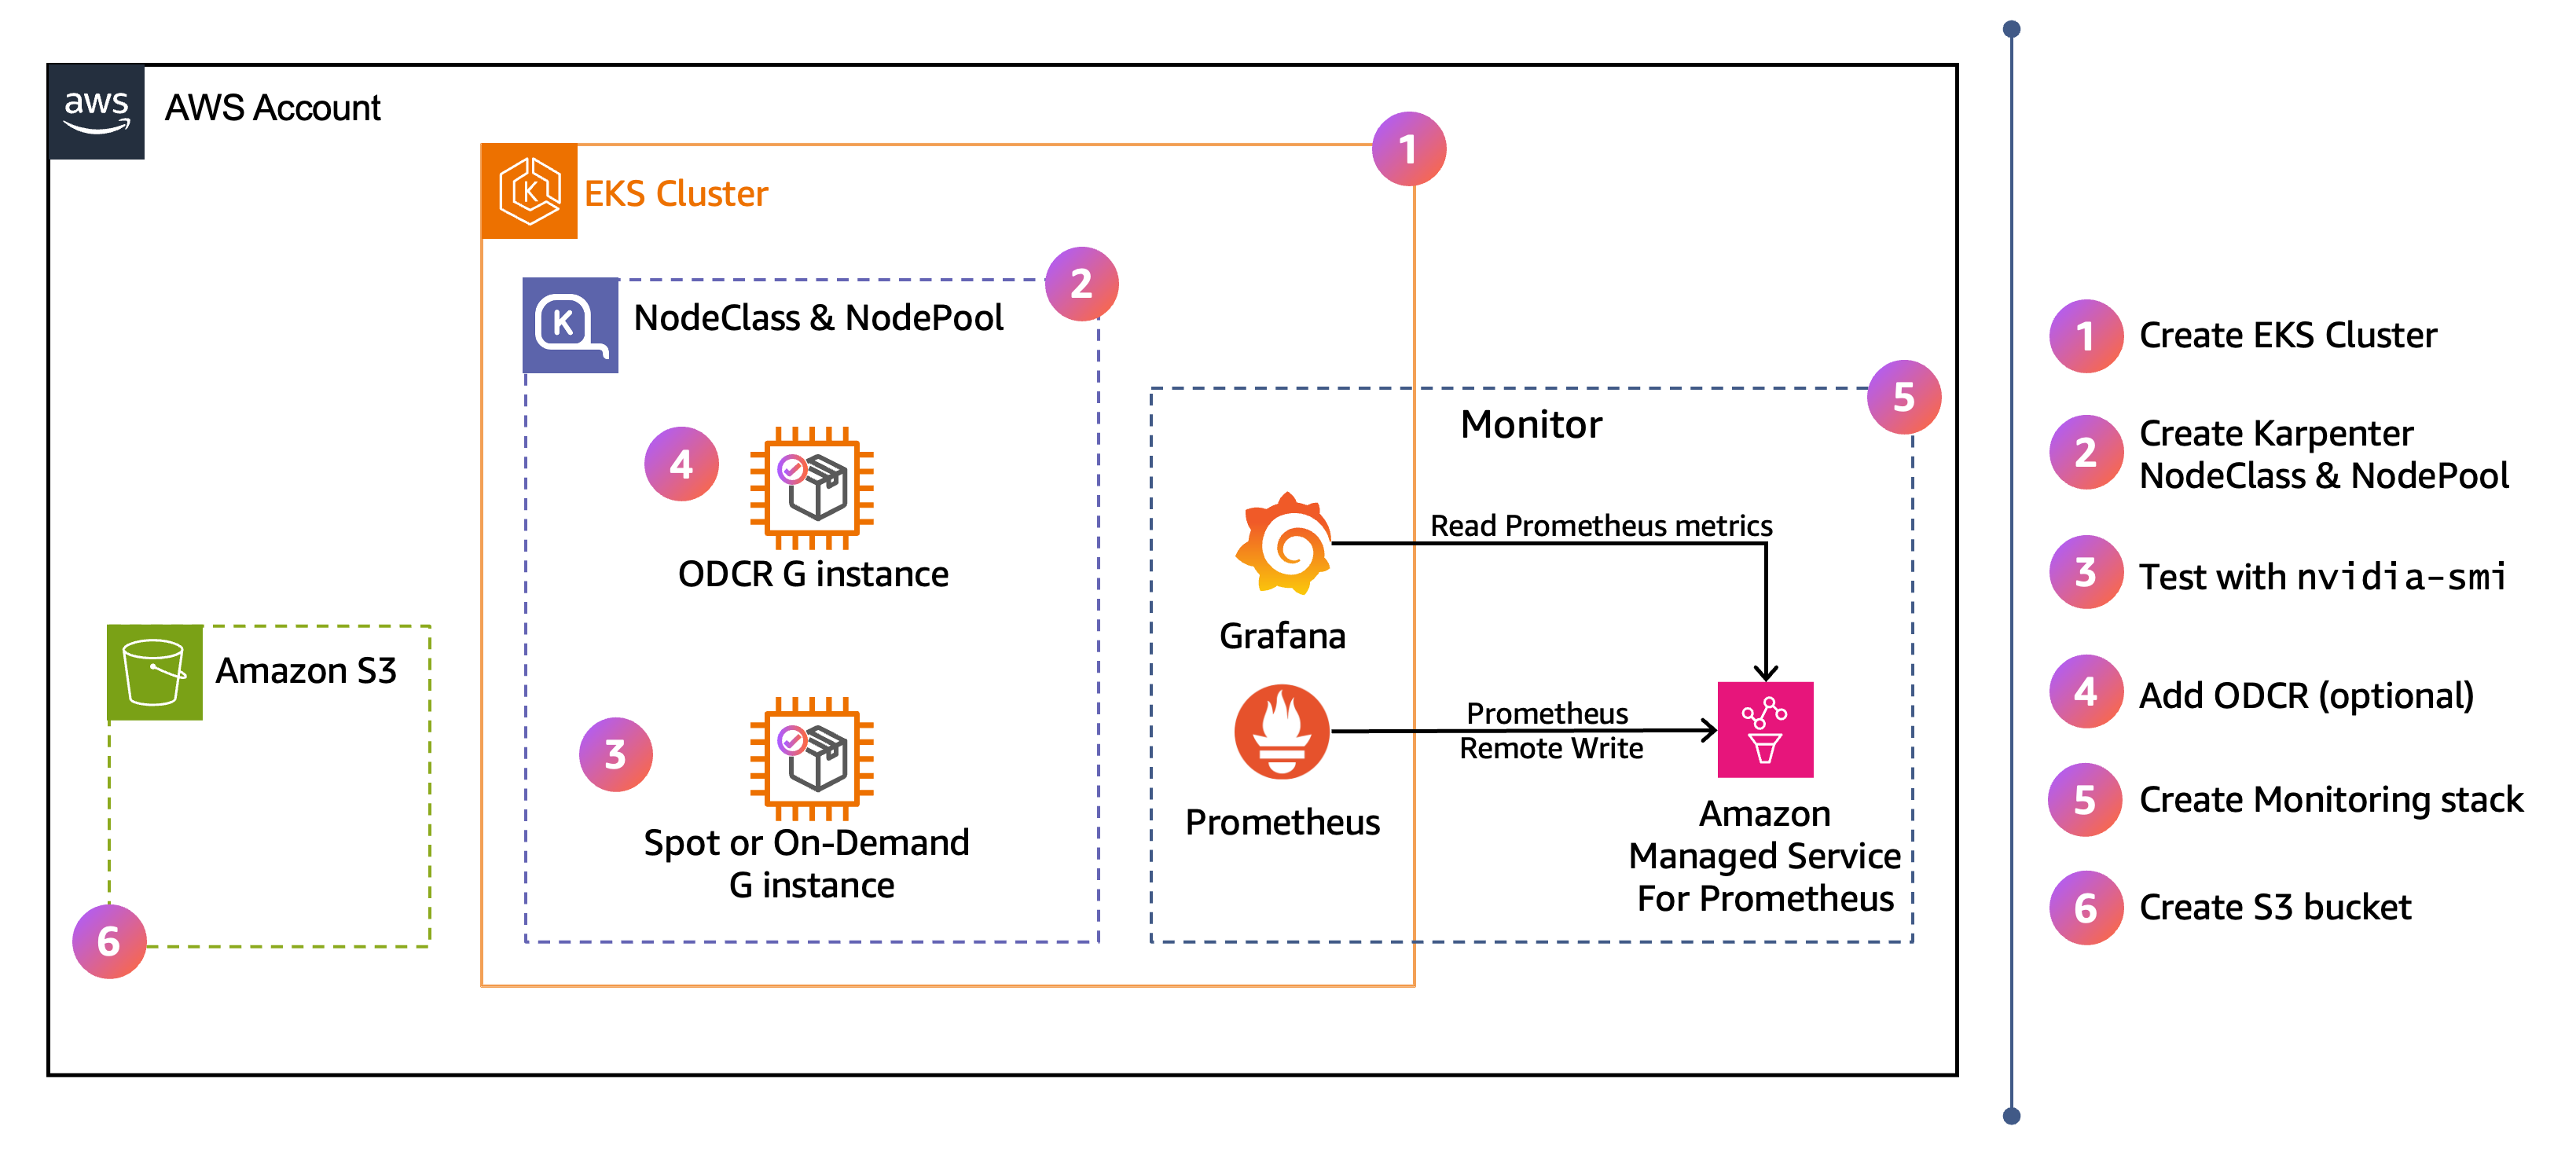
圖表顯示本節設定的 AWS 高階架構。右側的編號步驟指出您在以下步驟中完成組態的順序。
先決條件
-
kubectl>= 1.35。如需設定說明,請參閱 設定 kubectl 和 eksctl。 -
AWS CLI >= 2.27。如需設定說明,請參閱安裝。
-
Helm >= 3.14。如需設定說明,請參閱設定 Helm。
-
jq。 如需設定說明,請參閱下載 jq。 -
eksctl>= 0.227.0。如需設定說明,請參閱eksctl文件中的安裝。
驗證您的eksctl版本:
eksctl version
如果您使用的版本早於 0.227.0,請遵循 eksctl 安裝指南
設定環境變數
在這些步驟中保持以下叢集名稱和 AWS 區域一致。變更它可能會導致後續命令以錯誤 EKS 叢集為目標。
export CLUSTER_NAME=ai-eks-docs
export AWS_REGION=us-east-2
使用所有可用的可用 AZs 可改善容錯能力,並增加取得 GPU 容量的機會:
export AZS=$(aws ec2 describe-availability-zones \
  --region ${AWS_REGION} \
  --query "AvailabilityZones[?ZoneId!='use1-az3' && ZoneId!='usw1-az2' && ZoneId!='cac1-az3'].ZoneName" \
  --output text | tr '\t' ',')
echo $AZS
重要
cac1-az3 排除可用區域 use1-az3、 和 usw1-az2,因為 Amazon EKS 不支援在這些區域中放置控制平面UnsupportedAvailabilityZoneException。
預期的輸出結果:
us-east-2a,us-east-2b,us-east-2c
輸出中的 AZs 會因區域而異。此範例顯示us-east-2區域的可用 AZs。
建立叢集和 GPU NodePool
本節提供兩種建立 EKS 叢集和 GPU 節點的路徑,如下圖所示。在整個指南中僅選擇一個選項。
-
EKS Auto Mode — 除了核心聯網、儲存和負載平衡附加元件之外,EKS Auto Mode 還包含和管理下列訓練和推論工作負載的功能:EKS 節點監控代理程式、自動節點修復、用於快速容器提取的 SOCI
快照器,以及預設 NodeClass 的 GPU 準備程度。NVIDIA 裝置外掛程式包含在 Bottlerocket 加速 AMI 中,EKS Auto Mode 用於已啟用 GPU 的節點。 -
自我管理 Karpenter:在沒有 EKS Auto Mode 的 EKS 叢集上,您必須負責安裝和設定訓練和推論工作負載所需的元件。這包括聯網附加元件 (VPC CNI、CoreDNS、kube-proxy)、Karpenter、EKS 節點監控代理程式、NVIDIA 裝置外掛程式,以及用於快速容器提取的 SOCI 快照器。
EKS 叢集選項:EKS Auto Mode 和自我管理 Karpenter
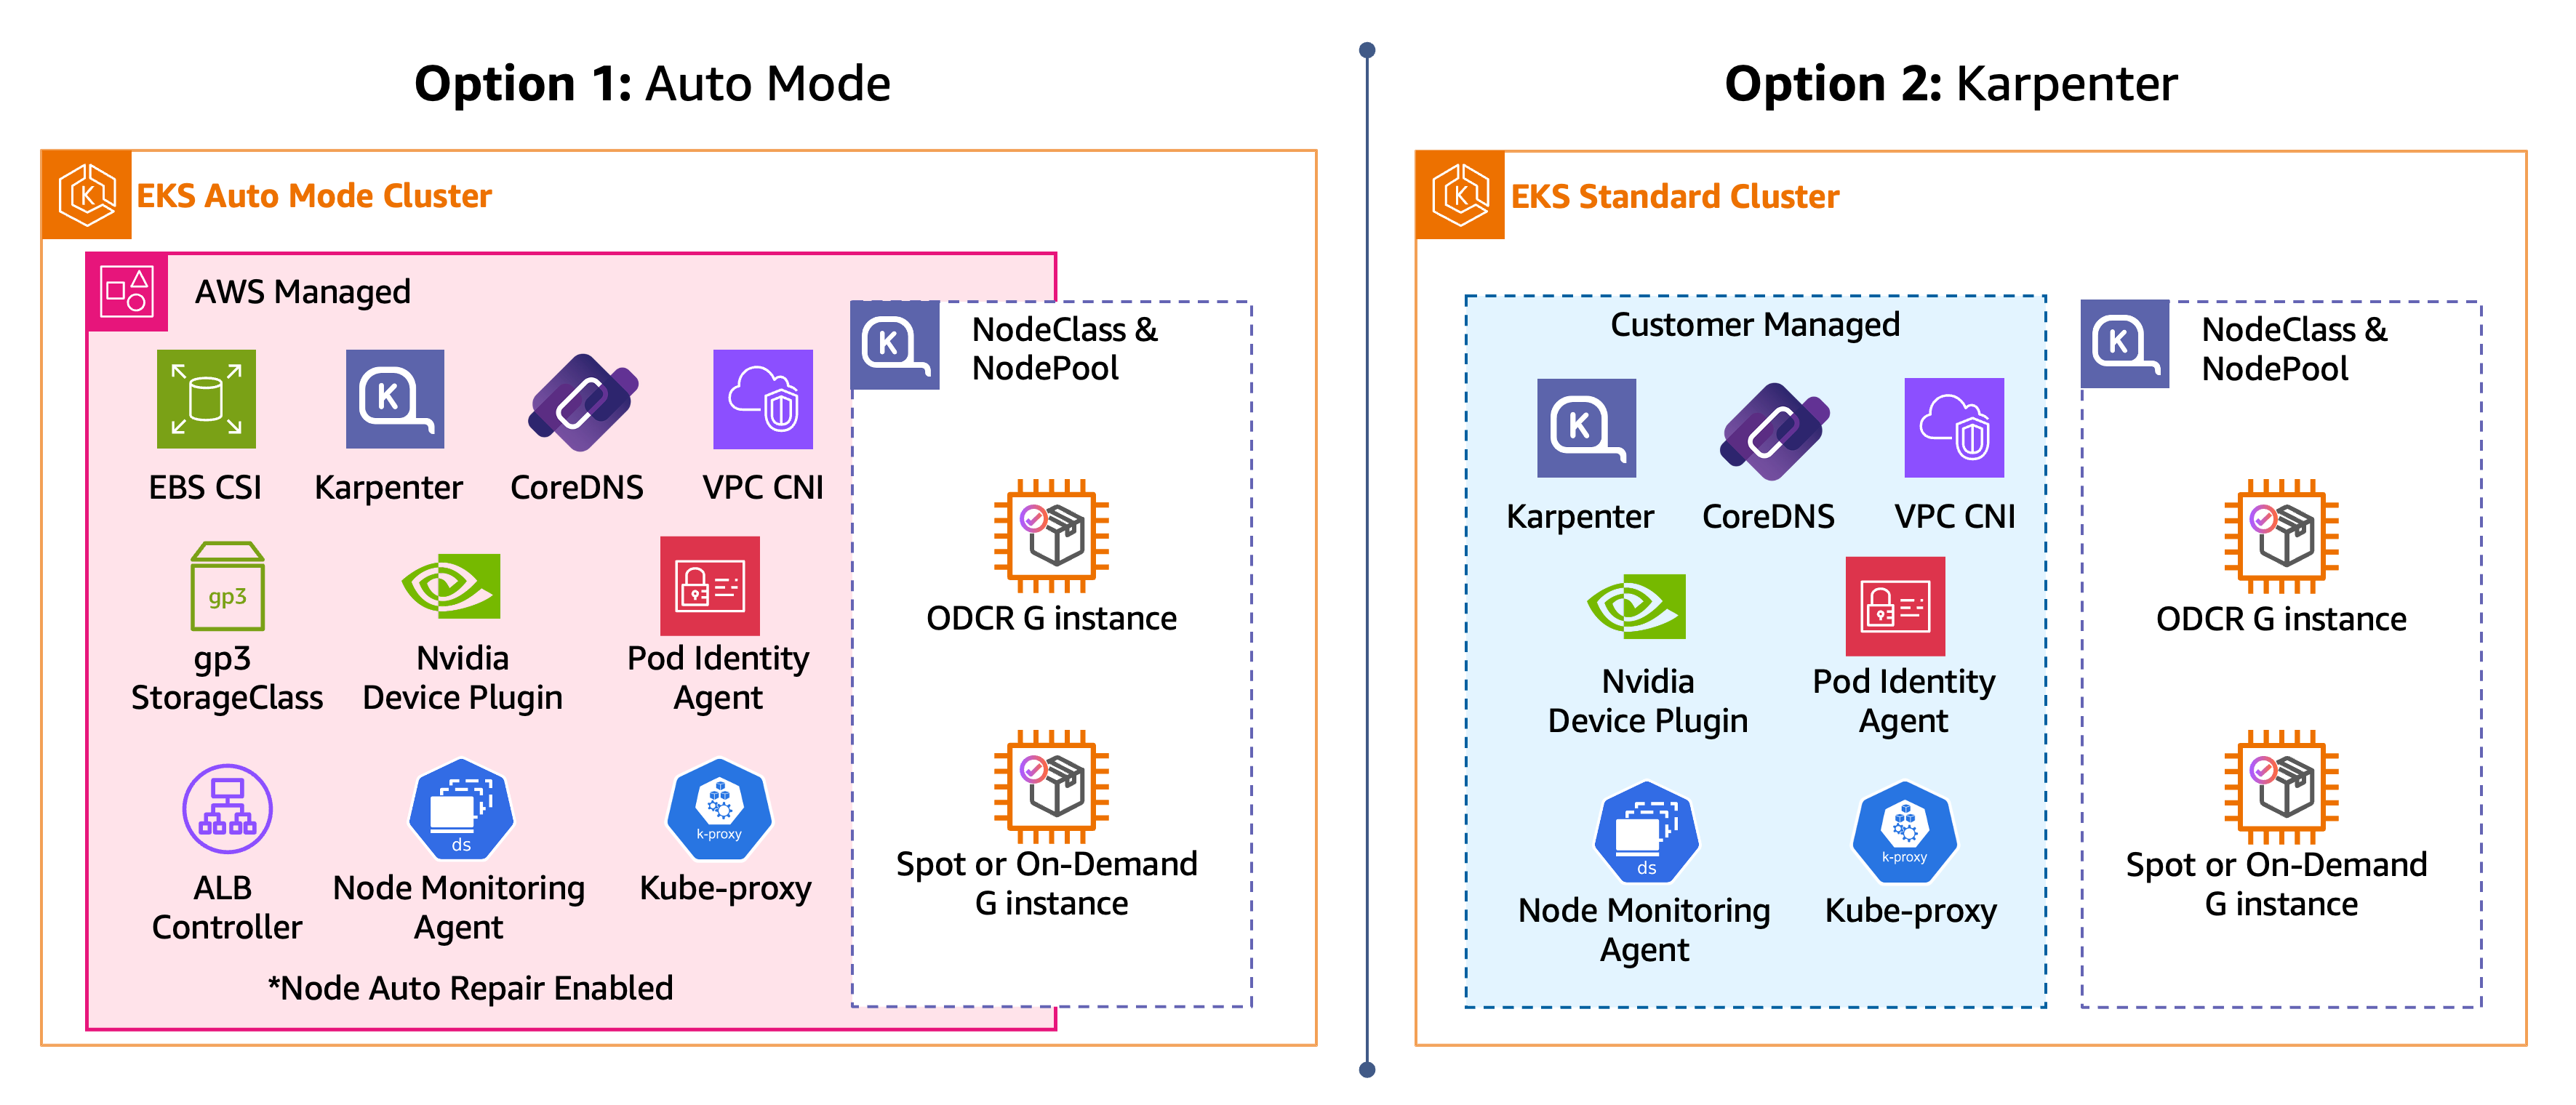
在下列每個步驟中,選擇路徑 (EKS Auto Mode、Karpenter) 並完全遵循。完成所選路徑的步驟後,您將擁有具有 GPU NodePool 的 EKS 叢集,準備好排程 GPU 工作負載。
步驟 1:建立叢集
首先建立 EKS 叢集,並安裝 GPU 工作負載所需的叢集元件。
使用 EKS Auto Mode 時,單一eksctl create cluster --enable-auto-mode命令會佈建適用於 GPU 工作負載的 EKS 叢集。
使用自我管理的 Karpenter,eksctl create cluster命令會佈建核心聯網附加元件,然後需要額外的步驟,才能透過 Karpenter 功能閘道啟用自動節點修復、安裝 EKS 節點監控代理程式,以及安裝 NVIDIA 裝置外掛程式。
警告
對於 EKS Auto Mode 和自我管理的 Karpenter 路徑,自動節點修復的行為與 NodePools 佈建的節點相同。EKS Auto Mode 和 Karpenter 中的自動節點修復是一種強而有力的中斷方法,可略過 PodDisruptionBudgets、karpenter.sh/do-not-disrupt註釋和 terminationGracePeriod。自動節點修復會等待 10 分鐘,再將條件AcceleratedHardwareReady設為 的節點取代為 False,將其他修復條件取代為 30 分鐘。
步驟 2:建立動態 GPU NodePool
定義 NodePool,使用 Spot 容量搭配隨需做為備用,動態佈建產生大於 4 的 G 系列 GPU 執行個體。EKS Auto Mode 和 Karpenter 路徑都使用相同的 NodePool API,唯一的區別在於其指向的 NodeClass。在 EKS Auto 模式中,綁定的 default NodeClass 已選取正確的 AMI 並設定 SOCI 平行提取,因此 NodePool 是您建立的唯一物件。在自我管理的 Karpenter 中,您也需要可EC2NodeClass固定 AMI 並調校 SOCI 的自訂。
驗證已建立 NodePool:
kubectl get nodepool gpu-inf
預期的輸出結果:
NAME      NODECLASS   NODES   READY   AGE
gpu-inf   default     0       True    8s
在自我管理 Karpenter 路徑上,NODECLASS 欄會顯示 gpu-inf而非 default。
步驟 3:使用範例 Pod 進行測試
使用 Pod 測試 GPU NodePool nvidia-smi 設定。
cat << EOF | kubectl apply -f -
apiVersion: v1
kind: Pod
metadata:
  name: nvidia-smi
  labels:
    guide: ai-eks-docs
spec:
  tolerations:
    - key: "nvidia.com/gpu"
      operator: "Exists"
      effect: "NoSchedule"
  containers:
    - name: nvidia-smi
      image: public.ecr.aws/amazonlinux/amazonlinux:2023-minimal
      command: ["nvidia-smi"]
      resources:
        limits:
          nvidia.com/gpu: 1
  restartPolicy: OnFailure
EOF
確認 Pod 已排程並成功完成。
kubectl get pods
預期的輸出結果:
NAME         READY   STATUS      RESTARTS   AGE
nvidia-smi   0/1     Completed   0          67s
STATUS: 已完成表示 nvidia-smi 命令已執行並結束。檢查 Pod 日誌以查看節點偵測到的 GPU。
kubectl logs nvidia-smi
預期的輸出結果:
+-----------------------------------------------------------------------------------------+
| NVIDIA-SMI 580.126.09             Driver Version: 580.126.09     CUDA Version: 13.0     |
+-----------------------------------------+------------------------+----------------------+
| GPU  Name                 Persistence-M | Bus-Id          Disp.A | Volatile Uncorr. ECC |
| Fan  Temp   Perf          Pwr:Usage/Cap |           Memory-Usage | GPU-Util  Compute M. |
|                                         |                        |               MIG M. |
|=========================================+========================+======================|
|   0  NVIDIA RTX PRO 6000 Blac...    On  |   00000000:2B:00.0 Off |                    0 |
| N/A   30C    P0             81W /  600W |       0MiB /  97887MiB |      0%      Default |
|                                         |                        |             Disabled |
+-----------------------------------------+------------------------+----------------------+
輸出會顯示 GPU 模型、驅動程式版本、CUDA 版本和可用的記憶體。在此範例中,Karpenter 佈建了具有 NVIDIA RTX PRO 6000 Blackwell GPU 和 96 GB 記憶體的 G7e 執行個體。30C 是目前的 GPU 溫度,P0 表示 GPU 處於最高效能狀態 (閒置但就緒)。81W / 600W 顯示目前的耗電量與最大電源容量,而 0MiB / 97887MiB 顯示目前使用的 GPU 記憶體與總可用容量。由於 Pod 剛執行 nvidia-smi 並結束,因此沒有工作負載正在使用 GPU,因此記憶體為 0,且電源處於閒置狀態。NVIDIA GPU 驅動程式版本 (580.126.09) 來自 Bottlerocket AMI,而 CUDA 版本 (13.0) 來自容器映像。GPU 模型和記憶體會根據 Karpenter 選取的執行個體類型而有所不同。G5 執行個體具有 NVIDIA A10G GPUs (24 GB)、G6e 執行個體具有 NVIDIA L40S GPUs (48 GB),而 G7e 執行個體具有 NVIDIA RTX PRO 6000 GPUs (96 GB)。
若要了解 Karpenter 和 Kubernetes 排程器如何協調以佈建節點並放置 Pod,請檢查 Pod 的生命週期事件:
kubectl describe po nvidia-smi
預期的輸出結果:
Events:
  Type     Reason                  Age   From                   Message
  ----     ------                  ----  ----                   -------
  Warning  FailedScheduling        60s   default-scheduler      0/2 nodes are available: 2 node(s) had untolerated taint(s). no new claims to deallocate, preemption: 0/2 nodes are available: 2 Preemption is not helpful for scheduling.
  Normal   Nominated               59s   eks-auto-mode/compute  Pod should schedule on: nodeclaim/gpu-inf-vxcnj
  Normal   Scheduled               24s   default-scheduler      Successfully assigned default/nvidia-smi to i-0fb17a09bc4203164
  Warning  FailedCreatePodSandBox  21s   kubelet                Failed to create pod sandbox: rpc error: code = Unknown desc = failed to setup network for sandbox "7f85e25b220c8fb245187758dbbbc8efb3d40f3e49e13054404880daf4c3b2f0": plugin type="aws-cni" name="aws-cni" failed (add): add cmd: failed to setup network policy
  Normal   Pulling                  7s   kubelet                spec.containers{nvidia-smi}: Pulling image "public.ecr.aws/amazonlinux/amazonlinux:2023-minimal"
  Normal   Pulled                   5s   kubelet                spec.containers{nvidia-smi}: Successfully pulled image "public.ecr.aws/amazonlinux/amazonlinux:2023-minimal" in 1.237s (1.237s including waiting). Image size: 37442701 bytes.
  Normal   Created                  5s   kubelet                spec.containers{nvidia-smi}: Container created
  Normal   Started                  5s   kubelet                spec.containers{nvidia-smi}: Container started
這些事件會顯示 Pod 排程序列:Pod 一開始無法排程,因為沒有 GPU 節點 (FailedScheduling),Karpenter 會指定新的 NodeClaim (Nominated),排程器會在節點就緒 (排程) 後指派 Pod,然後提取並啟動容器映像。EKS Auto Mode 在 G、P 和 Trn 執行個體上安裝並設定 SOCI (可擴展的 OCI) 平行提取。請注意,由於 SOCI 平行提取,容器映像在 2 秒 (1.237 秒) 內從 ECR 提取。
NodeClaim 是 Karpenter 建立來佈建特定節點的請求。它會顯示執行個體類型、容量類型、AZ,以及節點是否已就緒。
kubectl get nodeclaims
預期的 NodeClaim 輸出:
NAME            TYPE          CAPACITY    ZONE         NODE                  READY   AGE
gpu-inf-xxxxx   g7e.2xlarge   spot        us-east-2a   i-0xxxxxxxxxxxx       True    2m
執行個體類型和 AZ 會有所不同。產生 > 4 的任何 G 系列執行個體都符合資格。
中的FailedCreatePodSandBox警告kubectl describe pod nvidia-smi是暫時性且預期的。VPC CNI 會在節點聯結後以非同步方式初始化,而 kubelet 會自動重試。如果 Pod 保留在 中ContainerCreating,請使用 檢查節點事件kubectl describe node <node-name>。
提示
如果沒有出現節點,請檢查容量不足錯誤:
kubectl get events | grep InsufficientCapacityError
Karpenter 快取無法使用的方案 3 分鐘。擴大 NodePool 中允許的執行個體類型和可用AZs會增加登陸容量的機會。
注意
Karpenter 啟動的 Spot 執行個體不會出現在 EC2 Spot 請求主控台中。Karpenter 搭配 使用 EC2 CreateFleet APItype: instant。執行個體會以spot生命週期顯示在 EC2 執行個體主控台中。
步驟 4:將預留容量新增至 NodePool (選用)
若要先搭配 Spot/隨需備用使用預留容量,請建立隨需容量保留 (ODCR),並將其連接至 NodeClass,然後從步驟 2 更新動態 NodePool,以允許reserved容量。兩種路徑的保留 API 呼叫相同;NodeClass 連接不同,因為 EKS Auto Mode 和自我管理 Karpenter 使用不同的 NodeClass 類型。
警告
下列命令會產生預留執行個體類型的費用,直到您使用 將其取消為止aws ec2 cancel-capacity-reservation --capacity-reservation-id <id>。
建立容量保留:
CR_AZ="us-east-2a"
INSTANCE_TYPE="g6e.4xlarge"

aws ec2 create-capacity-reservation \
  --instance-type $INSTANCE_TYPE \
  --instance-platform Linux/UNIX \
  --availability-zone "$CR_AZ" \
  --instance-count 1 \
  --instance-match-criteria open \
  --end-date-type unlimited
如果您收到InsufficientInstanceCapacity錯誤,CR_AZ請變更為不同的可用區域,然後重試。
查詢容量保留 ID,並將其存放在 shell 變數中,以進行下列步驟:
CAPACITY_RESERVATION_ID=$(aws ec2 describe-capacity-reservations \
  --filters "Name=state,Values=active" "Name=instance-type,Values=${INSTANCE_TYPE}" \
  --query 'CapacityReservations[0].CapacityReservationId' \
  --output text \
  --region ${AWS_REGION})
echo "Capacity reservation ID: ${CAPACITY_RESERVATION_ID}"
然後將 NodeClass 和 NodePool 變更套用至您的路徑:
Karpenter reserved將 視為最具成本效益的選項,並優先啟動。一旦保留已滿,就會回到 Spot 或隨需。
套用變更後,請驗證 Karpenter 是否排定保留容量的優先順序,並回到 Spot 或隨需。部署 2 個複本部署,每個 Pod 請求 1 個 GPU。ODCR 適用於 1 個執行個體,因此第一個 Pod 會觸發 Karpenter 啟動預留節點。第二個 Pod 無法容納在預留節點上,並觸發 Karpenter 從 Spot 或隨需容量啟動另一個節點。
cat << 'EOF' | kubectl apply -f -
apiVersion: apps/v1
kind: Deployment
metadata:
  name: gpu-overflow-test
  labels:
    guide: ai-eks-docs
spec:
  replicas: 2
  selector:
    matchLabels:
      app: gpu-overflow-test
  template:
    metadata:
      labels:
        app: gpu-overflow-test
        guide: ai-eks-docs
    spec:
      tolerations:
        - key: nvidia.com/gpu
          operator: Exists
          effect: NoSchedule
      containers:
        - name: nvidia-smi
          image: public.ecr.aws/amazonlinux/amazonlinux:2023-minimal
          command: ["sh", "-c", "nvidia-smi && sleep infinity"]
          resources:
            limits:
              nvidia.com/gpu: 1
EOF
與執行和結束步驟 3 nvidia-smi的測試 Pod 不同,此部署會讓 Pod 保持執行 (sleep infinity),以便保留 GPU 且不釋出節點。
驗證在不同節點上排程的 Pod:
kubectl get pods -l app=gpu-overflow-test -o wide
預期的輸出結果:
NAME                                 READY   STATUS    RESTARTS   AGE     IP                NODE                  NOMINATED NODE   READINESS GATES
gpu-overflow-test-59b97944fb-lq56c   1/1     Running   0          2m42s   192.168.186.240   i-057692590480155da   <none>           <none>
gpu-overflow-test-59b97944fb-z4zcx   1/1     Running   0          2m42s   192.168.130.64    i-0521ecd1849fa0578   <none>           <none>
兩個 Pod 正在執行中,每個 都在不同的節點上。
檢查 NodeClaims 以查看容量類型:
kubectl get nodeclaims
預期的輸出結果:
NAME            TYPE          CAPACITY    ZONE         NODE                  READY   AGE
gpu-inf-shg5w   g6e.xlarge    reserved    us-east-2a   i-0ea91fdeef65b8cb6   True    2m2s
gpu-inf-ssnqf   g7e.2xlarge   spot        us-east-2b   i-00ccf7ce65cf3f6ca   True    112s
預留節點會先啟動,然後在保留完成後啟動 Spot 或隨需節點。
清除測試部署:
kubectl delete deployment gpu-overflow-test
監控
將收集叢集、節點和 GPU 指標的監控堆疊安裝到 Amazon Managed Service for Prometheus (AMP),並使用 Grafana 將其視覺化。kube-prometheus-stack Helm Chart 會將 Prometheus 部署到 AMP 的湊集和遠端寫入指標,以及儀表板的自我管理 Grafana。NVIDIA DCGM Exporter 新增 GPU 特定的指標 (使用率、記憶體、溫度、功率、NVLink、張量活動)。
Prometheus、Grafana 和運算子預設會落在非 GPU 節點上,因為 GPU nvidia.com/gpu:NoSchedule 節點帶有污點。Node-exporter 和 DCGM Exporter 都會在 GPU 節點上執行,因此我們可以在整個機群中抓取主機和 GPU 指標。
如果您開啟新的終端機,請設定叢集名稱和區域:
export CLUSTER_NAME=ai-eks-docs
export AWS_REGION=us-east-2
建立 AMP 工作區
建立 AMP 工作區以存放指標:
aws amp create-workspace \
  --alias "amp-ws-${CLUSTER_NAME}" \
  --region ${AWS_REGION}
取得工作區 ID:
AMP_WORKSPACE_ID=$(aws amp list-workspaces \
  --alias "amp-ws-${CLUSTER_NAME}" \
  --query 'workspaces[0].workspaceId' \
  --output text \
  --region ${AWS_REGION})

echo "AMP Workspace ID: ${AMP_WORKSPACE_ID}"
取得遠端寫入端點:
AMP_ENDPOINT=$(aws amp describe-workspace \
  --workspace-id ${AMP_WORKSPACE_ID} \
  --query 'workspace.prometheusEndpoint' \
  --output text \
  --region ${AWS_REGION})

echo "AMP Endpoint: ${AMP_ENDPOINT}"
建立 IAM 政策和 EKS Pod 身分關聯
建立 IAM 政策,允許 Prometheus 遠端寫入指標和 Grafana 查詢它們:
ACCOUNT_ID=$(aws sts get-caller-identity --query Account --output text)

AMP_POLICY_ARN=$(aws iam create-policy \
  --policy-name "${CLUSTER_NAME}-amp-grafana-policy" \
  --policy-document "{\"Version\": \"2012-10-17\", \"Statement\": [{\"Sid\": \"AllowAMPReadWrite\", \"Effect\": \"Allow\", \"Action\": [\"aps:ListWorkspaces\", \"aps:DescribeWorkspace\", \"aps:GetMetricMetadata\", \"aps:GetSeries\", \"aps:QueryMetrics\", \"aps:RemoteWrite\", \"aps:GetLabels\"], \"Resource\": \"arn:aws:aps:${AWS_REGION}:${ACCOUNT_ID}:workspace/*\"}, {\"Sid\": \"AllowCloudWatchMetrics\", \"Effect\": \"Allow\", \"Action\": [\"cloudwatch:DescribeAlarmsForMetric\", \"cloudwatch:ListMetrics\", \"cloudwatch:GetMetricData\", \"cloudwatch:GetMetricStatistics\"], \"Resource\": \"*\"}]}" \
  --query 'Policy.Arn' \
  --output text)

echo "AMP Policy ARN: ${AMP_POLICY_ARN}"
建立 Prometheus 和 Grafana 的監控命名空間和服務帳戶:
kubectl create namespace monitoring
kubectl create serviceaccount amp-iamproxy-ingest-service-account -n monitoring
kubectl create serviceaccount grafana-sa -n monitoring
建立 EKS Pod 身分關聯,將服務帳戶連結至 IAM 政策:
eksctl create podidentityassociation \
  --cluster ${CLUSTER_NAME} \
  --namespace monitoring \
  --service-account-name amp-iamproxy-ingest-service-account \
  --role-name "${CLUSTER_NAME}-amp-ingest-role" \
  --permission-policy-arns ${AMP_POLICY_ARN} \
  --region ${AWS_REGION}

eksctl create podidentityassociation \
  --cluster ${CLUSTER_NAME} \
  --namespace monitoring \
  --service-account-name grafana-sa \
  --role-name "${CLUSTER_NAME}-grafana-role" \
  --permission-policy-arns ${AMP_POLICY_ARN} \
  --region ${AWS_REGION}
確認已建立兩個 EKS Pod 身分關聯:
eksctl get podidentityassociation --cluster ${CLUSTER_NAME} --region ${AWS_REGION}
預期的輸出應在monitoring命名空間grafana-sa中同時包含 amp-iamproxy-ingest-service-account和 。
安裝 kube-prometheus-stack
新增 Helm 儲存庫:
helm repo add prometheus-community https://prometheus-community.github.io/helm-charts
helm repo update
此值檔案會省略 Prometheus、Grafana 和運算子的 nodeSelector:GPU nvidia.com/gpu:NoSchedule 節點的污點會使其遠離 GPU 節點,因此預設會落在系統或一般用途集區上。Node-exporter 使用萬用字元公差,以便在包括 GPU 節點在內的每個節點上執行,以在整個機群中收集指標。
建立值檔案:
範例 kube-prometheus-stack 值檔案
cat << EOF > /tmp/kube-prometheus-values.yaml
alertmanager:
  enabled: false

prometheus-adapter:
  enabled: false

prometheus:
  serviceAccount:
    create: false
    name: amp-iamproxy-ingest-service-account
  prometheusSpec:
    serviceAccountName: amp-iamproxy-ingest-service-account
    enableRemoteWriteReceiver: true
    retention: 2h
    scrapeInterval: 30s
    evaluationInterval: 30s
    podMonitorSelectorNilUsesHelmValues: false
    serviceMonitorSelectorNilUsesHelmValues: false
    resources:
      requests:
        cpu: 500m
        memory: 1Gi
      limits:
        memory: 8Gi
    remoteWrite:
      - url: "${AMP_ENDPOINT}api/v1/remote_write"
        sigv4:
          region: "${AWS_REGION}"
        queueConfig:
          maxSamplesPerSend: 1000
          maxShards: 200
          capacity: 2500
    nodeSelector:
      node-role: system

prometheusOperator:
  resources:
    requests:
      cpu: 100m
      memory: 128Mi
    limits:
      memory: 256Mi
  nodeSelector:
    node-role: system
  admissionWebhooks:
    patch:
      nodeSelector:
        node-role: system

kube-state-metrics:
  resources:
    requests:
      cpu: 50m
      memory: 128Mi
    limits:
      memory: 512Mi
  nodeSelector:
    node-role: system

grafana:
  enabled: true
  serviceAccount:
    create: false
    name: grafana-sa
  resources:
    requests:
      cpu: 100m
      memory: 256Mi
    limits:
      memory: 1Gi
  nodeSelector:
    node-role: system
  grafana.ini:
    auth.sigv4:
      enabled: true
  sidecar:
    datasources:
      defaultDatasourceEnabled: false
  plugins:
    - grafana-amazonprometheus-datasource
  additionalDataSources:
    - name: Amazon-Managed-Prometheus
      type: grafana-amazonprometheus-datasource
      access: proxy
      url: "${AMP_ENDPOINT}"
      isDefault: true
      jsonData:
        sigV4Auth: true
        defaultRegion: "${AWS_REGION}"
        sigV4Region: "${AWS_REGION}"
      editable: true
  dashboardProviders:
    dashboardproviders.yaml:
      apiVersion: 1
      providers:
        - name: default
          orgId: 1
          folder: 'GPU Monitoring'
          type: file
          disableDeletion: false
          editable: true
          options:
            path: /var/lib/grafana/dashboards/default
  dashboards:
    default:
      nvidia-dcgm:
        gnetId: 25261
        revision: 1
        datasource:
          - name: DS_PROMETHEUS
            value: Amazon-Managed-Prometheus
      vllm:
        gnetId: 25263
        revision: 1
        datasource:
          - name: DS_PROMETHEUS
            value: Amazon-Managed-Prometheus
      vllm-load-analysis:
        gnetId: 25494
        revision: 1
        datasource:
          - name: DS_PROMETHEUS
            value: Amazon-Managed-Prometheus

prometheus-node-exporter:
  resources:
    requests:
      cpu: 50m
      memory: 64Mi
    limits:
      memory: 128Mi
  tolerations:
    - operator: Exists
EOF
驗證變數是否正確填入:
grep -E "url:|region:" /tmp/kube-prometheus-values.yaml
您應該會看到完整的 AMP 端點 URL (以 開頭https://aps-workspaces…) 和您的區域。如果其中一個是空的,請重新匯出變數並重新建立檔案。
安裝圖表:
helm install kube-prometheus-stack prometheus-community/kube-prometheus-stack \
  --namespace monitoring \
  -f /tmp/kube-prometheus-values.yaml
驗證 Pod 正在執行:
kubectl get pods -n monitoring
預期的輸出結果:
NAME                                                       READY   STATUS    RESTARTS   AGE
kube-prometheus-stack-grafana-7c58f54f77-rftrj             3/3     Running   0          4m
kube-prometheus-stack-kube-state-metrics-d68dcbc84-5smxq   1/1     Running   0          4m
kube-prometheus-stack-operator-5895df479f-ttm47            1/1     Running   0          4m
kube-prometheus-stack-prometheus-node-exporter-t9q7s       1/1     Running   0          4m
kube-prometheus-stack-prometheus-node-exporter-x6vfb       1/1     Running   0          4m
prometheus-kube-prometheus-stack-prometheus-0              2/2     Running   0          4m
堆疊會部署下列元件:
-
Prometheus (StatefulSet):抓取指標並將其遠端寫入 AMP
-
Grafana:儀表板和視覺化,使用 AMP 資料來源預先設定
-
kube-state-metrics:產生有關 Kubernetes 物件狀態的指標 (Pod 狀態、資源請求/限制、NodeClaim 狀態)
-
node-exporter (DaemonSet,每個節點一個):收集主機層級指標 (CPU、記憶體、磁碟、網路)
-
運算子:管理 Prometheus 和 Alertmanager 自訂資源
警示管理員在此設定中已停用。
存取 Grafana
開啟單獨的終端機並向前移植以存取 Grafana:
kubectl port-forward svc/kube-prometheus-stack-grafana 3000:80 -n monitoring
在瀏覽器http://localhost:3000admin下列命令使用使用者名稱和密碼登入:
kubectl --namespace monitoring get secrets kube-prometheus-stack-grafana -o jsonpath="{.data.admin-password}" | base64 -d ; echo
若要驗證指標管道是否端對端運作:
-
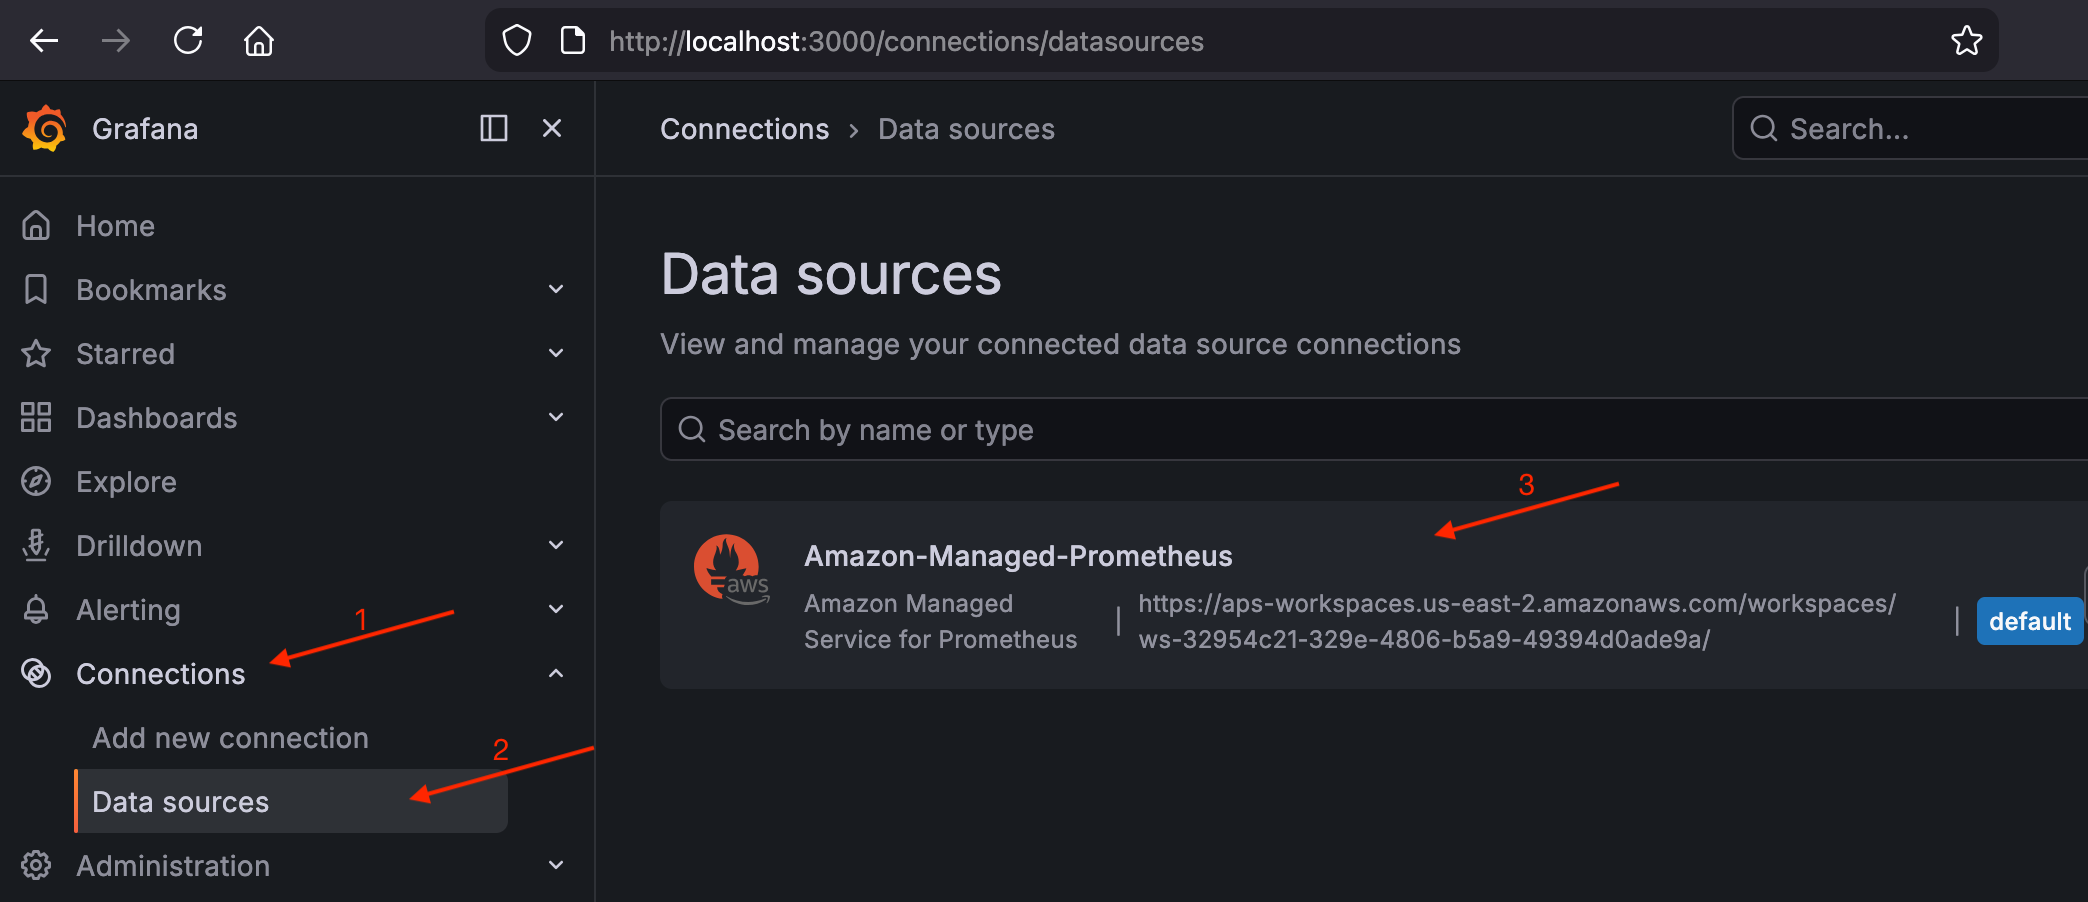
導覽至連線 > 資料來源,並確認
Amazon-Managed-Prometheus列為預設資料來源。驗證 Grafana 中的 AMP 資料來源
-
導覽至向下切入 > 指標並搜尋指標。
up您應該會看到叢集湊集目標的結果。驗證
upGrafana 中的指標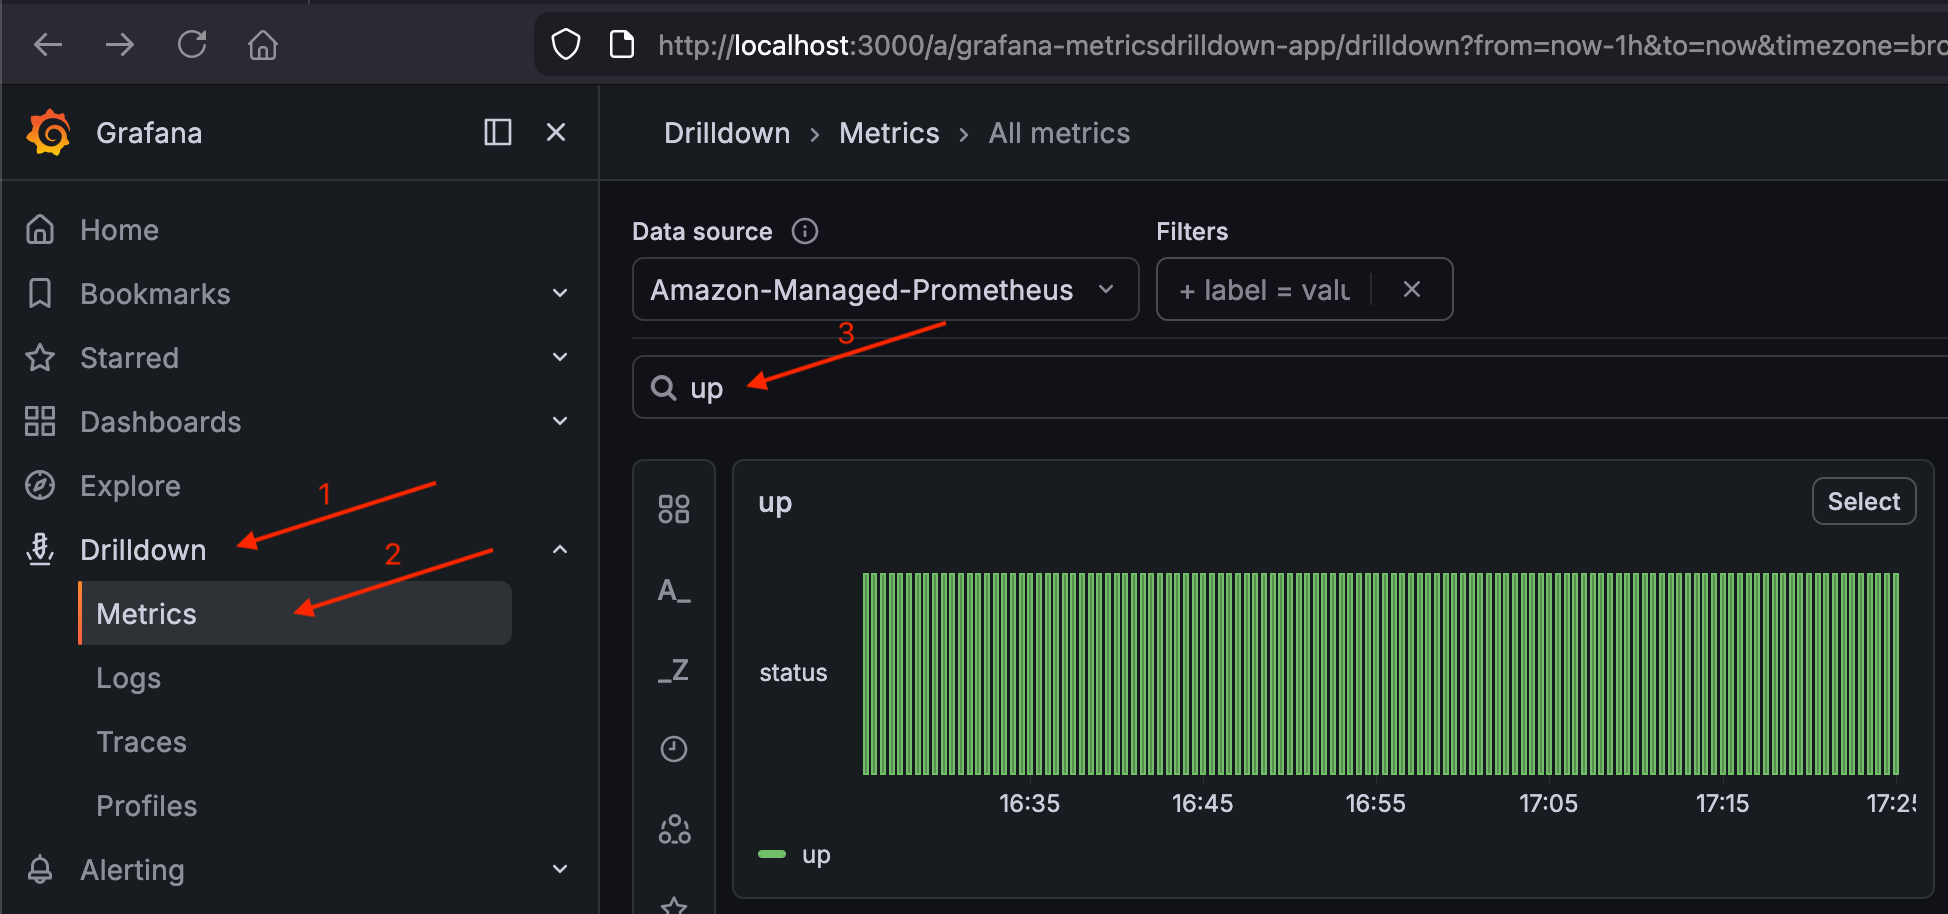
如果 up顯示結果,表示管道 (叢集 → Prometheus → AMP → Grafana) 正在運作。
部署適用於 GPU 指標的 DCGM Exporter
kube-prometheus-stack 會收集節點層級的 CPU 和記憶體指標,但不會收集 GPU 指標。NVIDIA DCGM Exporter 新增 GPU 使用率、記憶體用量、溫度、耗電量、NVLink 頻寬和張量活動。
helm repo add gpu-helm-charts https://nvidia.github.io/dcgm-exporter/helm-charts
helm repo update
為您的路徑設定 GPU 節點選擇器金鑰。EKS Auto Mode 和自我管理 Karpenter 使用 GPU 製造商的不同標籤金鑰。
建立 DCGM 匯出工具值檔案:
範例 dcgm-exporter 值檔案
cat << EOF > /tmp/dcgm-exporter-values.yaml
resources:
  requests:
    memory: "512Mi"
    cpu: "100m"
  limits:
    memory: "1Gi"
    cpu: "500m"

serviceMonitor:
  enabled: true
  additionalLabels:
    release: kube-prometheus-stack

nodeSelector:
  ${GPU_NODE_SELECTOR_KEY}: nvidia

tolerations:
  - key: "nvidia.com/gpu"
    operator: "Exists"
    effect: "NoSchedule"

customMetrics: |
  # Clocks
  DCGM_FI_DEV_SM_CLOCK,  gauge, SM clock frequency (in MHz).
  DCGM_FI_DEV_MEM_CLOCK, gauge, Memory clock frequency (in MHz).
  # Temperature
  DCGM_FI_DEV_MEMORY_TEMP, gauge, Memory temperature (in C).
  DCGM_FI_DEV_GPU_TEMP,    gauge, GPU temperature (in C).
  # Power
  DCGM_FI_DEV_POWER_USAGE,              gauge, Power draw (in W).
  DCGM_FI_DEV_TOTAL_ENERGY_CONSUMPTION, counter, Total energy consumption since boot (in mJ).
  # PCIe
  DCGM_FI_PROF_PCIE_TX_BYTES,  counter, Number of bytes transmitted through PCIe TX (in KB) via NVML.
  DCGM_FI_PROF_PCIE_RX_BYTES,  counter, Number of bytes received through PCIe RX (in KB) via NVML.
  DCGM_FI_DEV_PCIE_REPLAY_COUNTER, counter, Total number of PCIe retries.
  # Utilization (the sample period varies depending on the product)
  DCGM_FI_DEV_GPU_UTIL,      gauge, GPU utilization (in %).
  DCGM_FI_DEV_MEM_COPY_UTIL, gauge, Memory utilization (in %).
  DCGM_FI_DEV_ENC_UTIL,      gauge, Encoder utilization (in %).
  DCGM_FI_DEV_DEC_UTIL,      gauge, Decoder utilization (in %).
  # Errors and violations
  DCGM_FI_DEV_XID_ERRORS,            gauge, Value of the last XID error encountered.
  DCGM_EXP_XID_ERRORS_COUNT,         gauge, Value of count of XID errors encountered.
  DCGM_FI_DEV_POWER_VIOLATION,       counter, Throttling duration due to power constraints (in us).
  DCGM_FI_DEV_THERMAL_VIOLATION,     counter, Throttling duration due to thermal constraints (in us).
  DCGM_FI_DEV_SYNC_BOOST_VIOLATION,  counter, Throttling duration due to sync-boost constraints (in us).
  DCGM_FI_DEV_BOARD_LIMIT_VIOLATION, counter, Throttling duration due to board limit constraints (in us).
  DCGM_FI_DEV_LOW_UTIL_VIOLATION,    counter, Throttling duration due to low utilization (in us).
  DCGM_FI_DEV_RELIABILITY_VIOLATION, counter, Throttling duration due to reliability constraints (in us).
  # Memory usage
  DCGM_FI_DEV_FB_FREE, gauge, Framebuffer memory free (in MiB).
  DCGM_FI_DEV_FB_USED, gauge, Framebuffer memory used (in MiB).
  # Retired pages
  DCGM_FI_DEV_RETIRED_SBE,     counter, Total number of retired pages due to single-bit errors.
  DCGM_FI_DEV_RETIRED_DBE,     counter, Total number of retired pages due to double-bit errors.
  DCGM_FI_DEV_RETIRED_PENDING, counter, Total number of pages pending retirement.
  # NVLink
  DCGM_FI_DEV_NVLINK_BANDWIDTH_TOTAL, counter, Total number of NVLink bandwidth counters for all lanes.
  DCGM_FI_PROF_NVLINK_TX_BYTES,       counter, The rate of data transmitted over NVLink not including protocol headers in bytes per second.
  DCGM_FI_PROF_NVLINK_RX_BYTES,       counter, The rate of data received over NVLink not including protocol headers in bytes per second.
  # DCP metrics
  DCGM_FI_PROF_GR_ENGINE_ACTIVE,   gauge, Ratio of time the graphics engine is active (in %).
  DCGM_FI_PROF_SM_ACTIVE,          gauge, The ratio of cycles an SM has at least 1 warp assigned (in %).
  DCGM_FI_PROF_SM_OCCUPANCY,       gauge, The ratio of number of warps resident on an SM (in %).
  DCGM_FI_PROF_PIPE_TENSOR_ACTIVE, gauge, Ratio of cycles the tensor (HMMA) pipe is active (in %).
  DCGM_FI_PROF_DRAM_ACTIVE,        gauge, Ratio of cycles the device memory interface is active sending or receiving data (in %).
  DCGM_FI_DEV_CLOCK_THROTTLE_REASONS, gauge, Current clock throttle reasons (bitmask of DCGM_CLOCKS_THROTTLE_REASON_*).
  DCGM_FI_DEV_GPU_NVLINK_ERRORS,      gauge, Identifies a GPU NVLink error type returned by DCGM_FI_DEV_GPU_NVLINK_ERRORS.
  ## NVLink
  DCGM_FI_DEV_NVLINK_BANDWIDTH_L0, counter, The number of bytes of active NVLink rx or tx data including both header and payload.
  ## Remapped rows
  DCGM_FI_DEV_UNCORRECTABLE_REMAPPED_ROWS, counter, Number of remapped rows for uncorrectable errors.
  DCGM_FI_DEV_CORRECTABLE_REMAPPED_ROWS, counter, Number of remapped rows for correctable errors.
  DCGM_FI_DEV_ROW_REMAP_FAILURE, gauge, whether remapping of rows has failed.
  ## Profiling metrics
  DCGM_FI_PROF_PIPE_FP64_ACTIVE, gauge, Ratio of cycles the fp64 pipes are active (in %).
  DCGM_FI_PROF_PIPE_FP32_ACTIVE, gauge, Ratio of cycles the fp32 pipes are active (in %).
  DCGM_FI_PROF_PIPE_FP16_ACTIVE, gauge, Ratio of cycles the fp16 pipes are active (in %).
  # ECC
  DCGM_FI_DEV_ECC_SBE_VOL_TOTAL, counter, Total number of single-bit volatile ECC errors.
  DCGM_FI_DEV_ECC_DBE_VOL_TOTAL, counter, Total number of double-bit volatile ECC errors.
EOF
customMetrics 欄位會使用延伸指標集覆寫 DCGM 匯出者的預設指標集,其中包含 NVLink 頻寬、張量活動、PCIe 輸送量、ECC 錯誤和熱調節。對於推論工作負載,這可協助您了解 GPU 運算單位是否充分利用、GPU 是否因為批次大小低而在請求之間閒置、CPU 和 GPU 之間的資料傳輸是否是瓶頸、熱調節是否造成延遲峰值,以及大型批次的 GPU 記憶體空間剩餘多少。
安裝 DCGM 匯出工具:
helm install dcgm-exporter gpu-helm-charts/dcgm-exporter \
  --namespace monitoring \
  -f /tmp/dcgm-exporter-values.yaml
允許匯出程式tolerations在您於步驟 2 佈建的 GPU 污點節點上執行。serviceMonitor 具有 release: kube-prometheus-stack標籤的 可確保 Prometheus 自動探索和抓取它。
驗證 DCGM 匯出工具 DaemonSet:
kubectl get daemonset dcgm-exporter -n monitoring
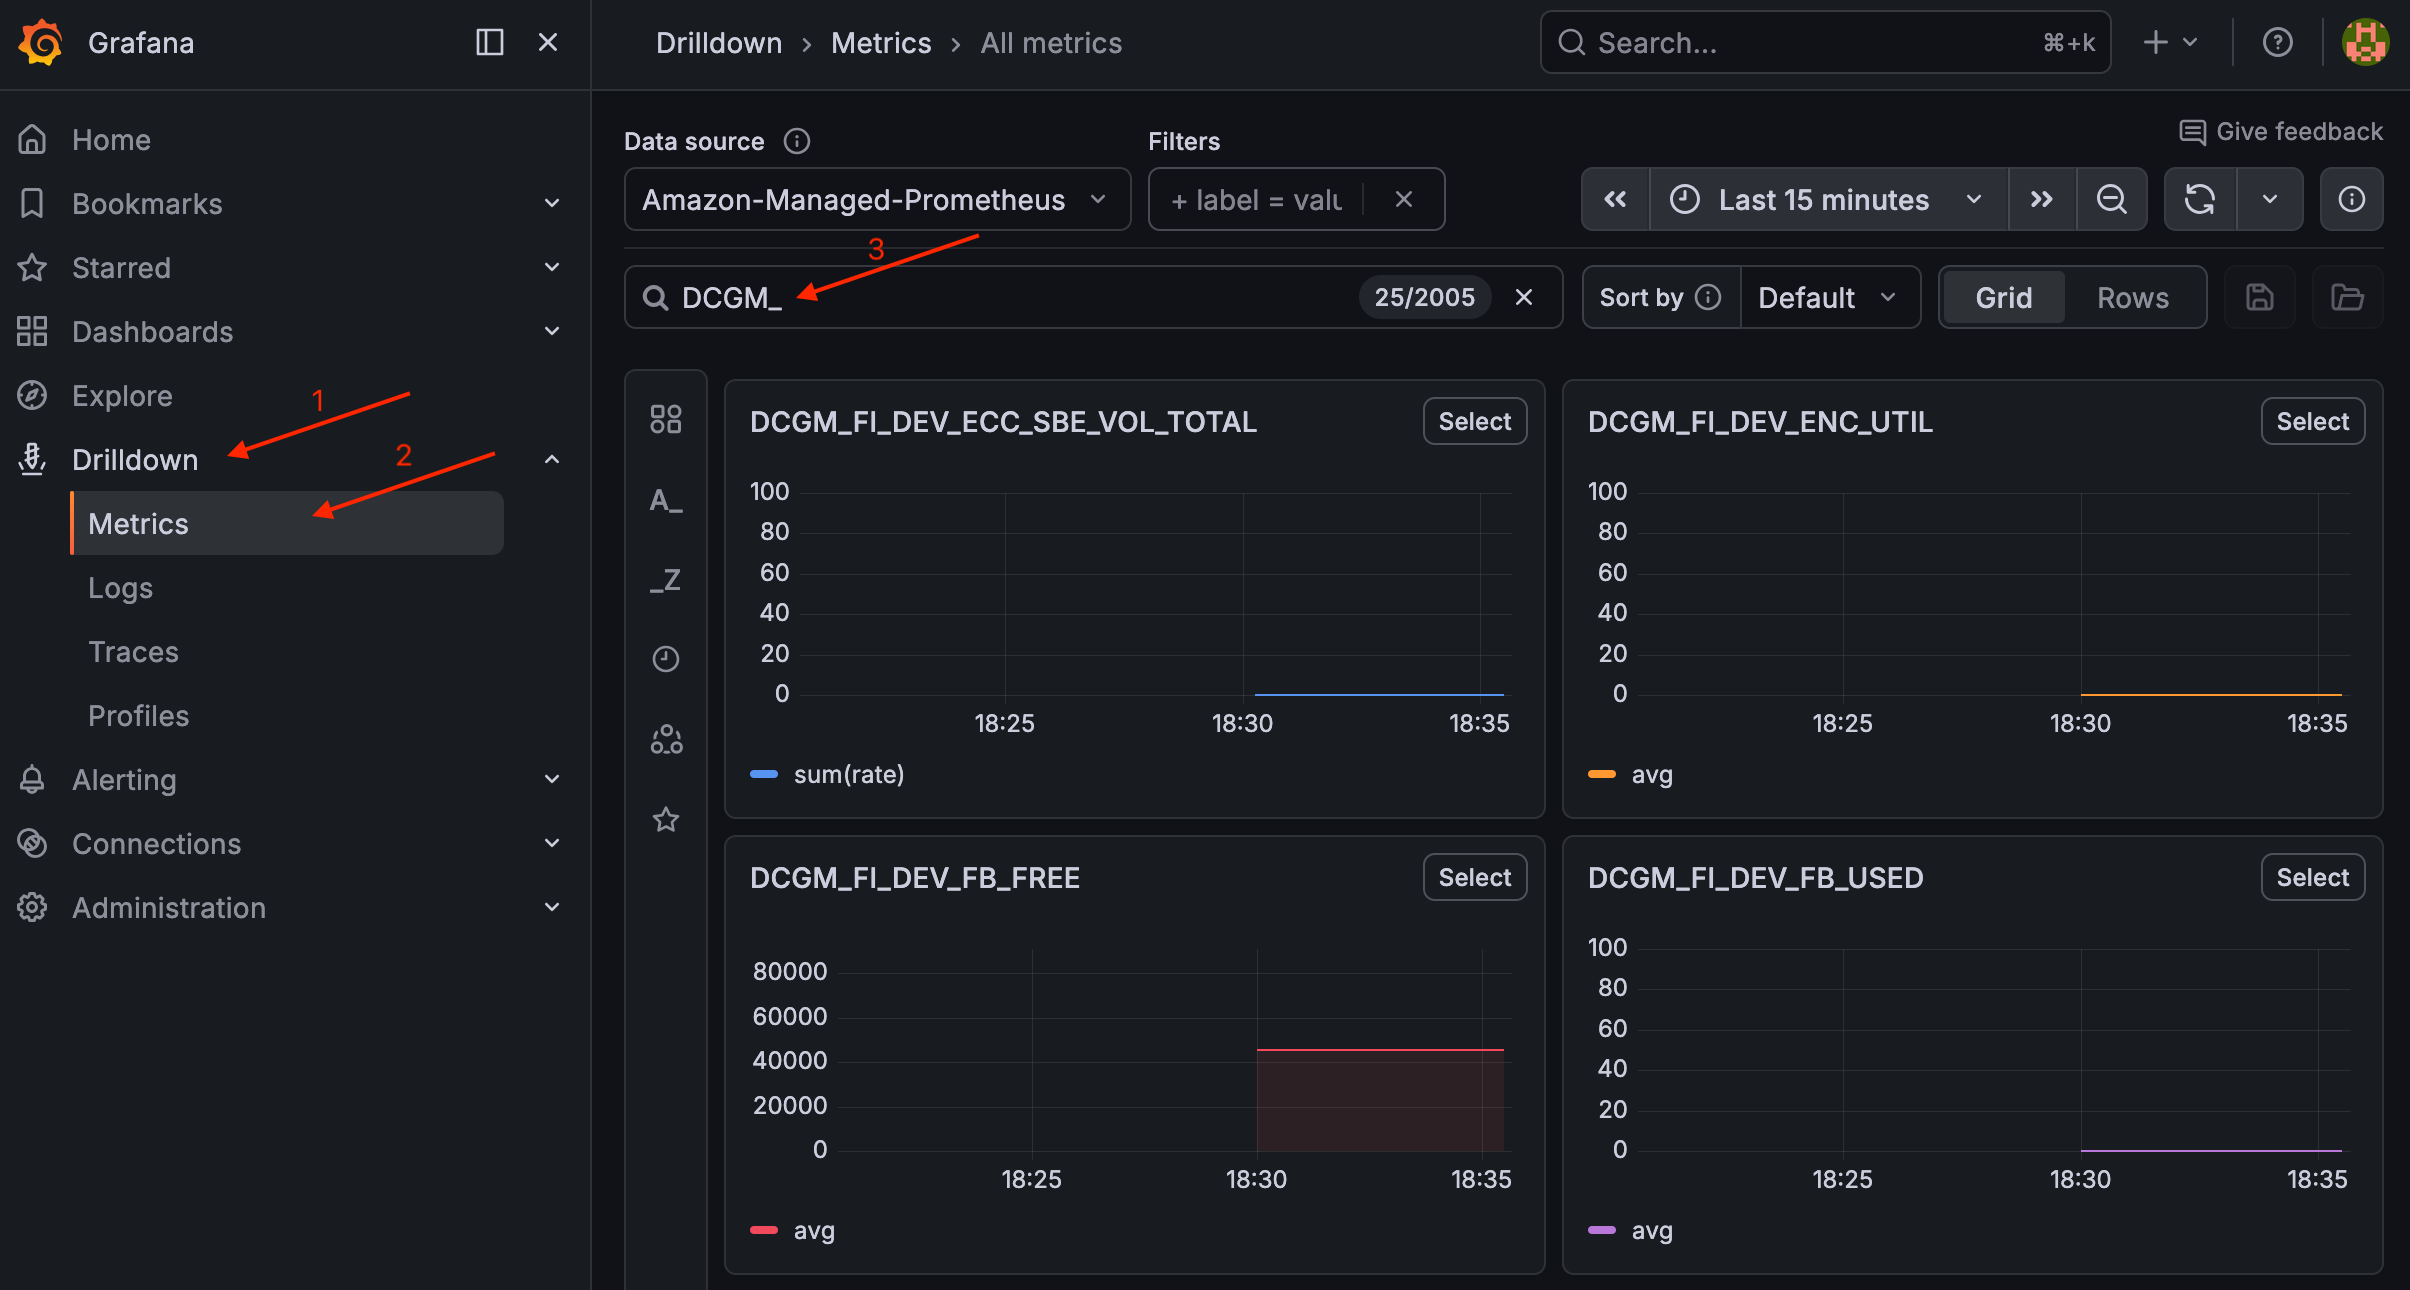
GPU 節點執行後,您應該會看到一個就緒的 Pod。若要驗證 DCGM 指標,請導覽至 Grafana 中的向下切入 > 指標,並搜尋 DCGM_。
在 Grafana 中驗證 DCGM 指標
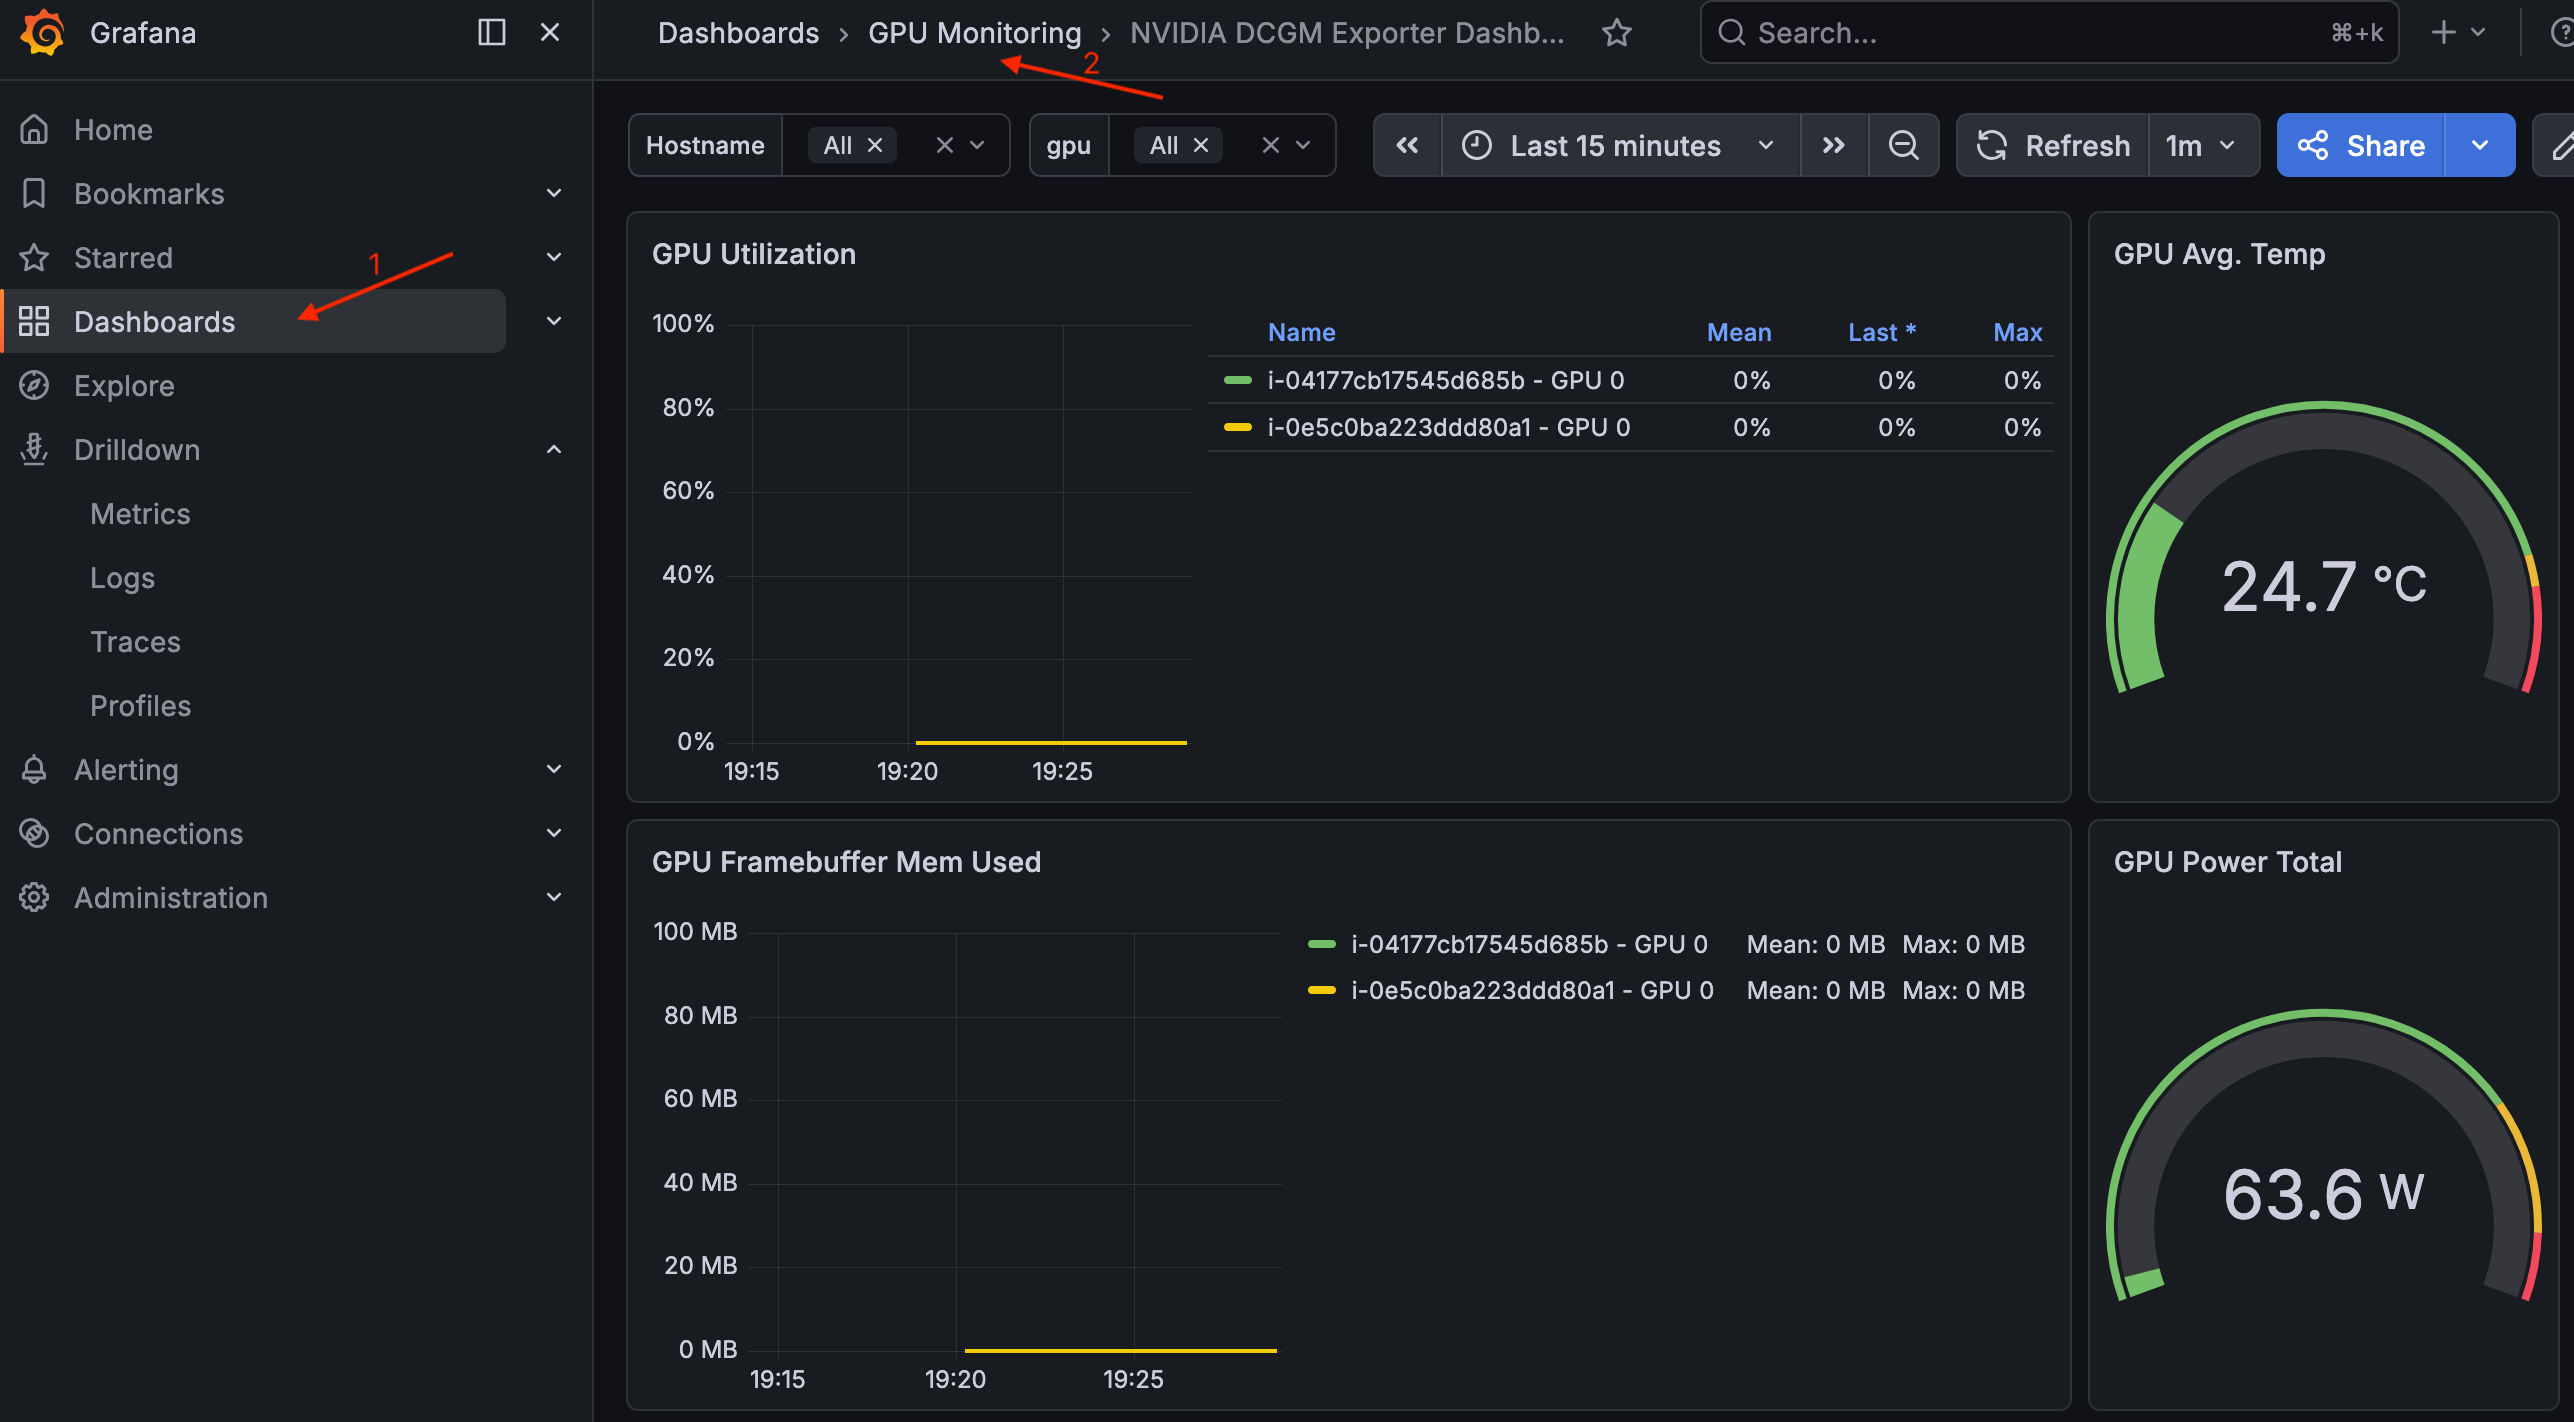
若要檢視儀表板,請導覽至儀表板 > GPU 監控 > NVIDIA DCGM 匯出工具儀表板。
Grafana 中的 NVIDIA DCGM 匯出工具儀表板
模型權重 S3 儲存貯體
建立 Amazon S3 儲存貯體來存放模型權重,並設定 EKS Pod Identity Association,以便工作負載 Pod 可以讀取和寫入模型權重。
如果您開啟新的終端機,請設定叢集名稱和區域:
export CLUSTER_NAME=ai-eks-docs
export AWS_REGION=us-east-2
建立 S3 儲存貯體
使用隨機尾碼建立儲存貯體,以避免名稱衝突:
BUCKET_SUFFIX=$(head -c 4 /dev/urandom | od -An -tx1 | tr -d ' \n')
MODEL_BUCKET="${CLUSTER_NAME}-models-${BUCKET_SUFFIX}"

aws s3 mb s3://${MODEL_BUCKET} --region ${AWS_REGION}
2023 年 1 月之後建立的 S3 儲存貯體預設會啟用伺服器端加密 (AES256) 和公有存取封鎖。
設定 S3 存取的 EKS Pod 身分
在default命名空間中建立 model-storage-sa ServiceAccount、範圍為模型儲存貯體的 IAM 政策,以及連結它們的 EKS Pod 身分關聯。設定的工作負載 Pod serviceAccountName: model-storage-sa將能夠讀取和寫入儲存貯體。
kubectl create serviceaccount model-storage-sa
建立 IAM 政策:
POLICY_ARN=$(aws iam create-policy \
  --policy-name "${CLUSTER_NAME}-model-storage-policy" \
  --policy-document "{\"Version\": \"2012-10-17\", \"Statement\": [{\"Effect\": \"Allow\", \"Action\": [\"s3:GetObject\", \"s3:PutObject\", \"s3:ListBucket\", \"s3:DeleteObject\"], \"Resource\": [\"arn:aws:s3:::${MODEL_BUCKET}\", \"arn:aws:s3:::${MODEL_BUCKET}/*\"]}]}" \
  --query 'Policy.Arn' \
  --output text)

echo "Policy ARN: ${POLICY_ARN}"
注意
此政策s3:PutObject會針對驗證步驟授予 s3:DeleteObject和 。對於只讀取模型權重的生產推論 Pod,請移除 s3:PutObject並s3:DeleteObject遵循最低權限。
建立 EKS Pod Identity Association。 會eksctl建立具有正確信任政策的 IAM 角色,並將其連結至 ServiceAccount:
eksctl create podidentityassociation \
  --cluster ${CLUSTER_NAME} \
  --namespace default \
  --service-account-name model-storage-sa \
  --role-name "${CLUSTER_NAME}-model-storage-role" \
  --permission-policy-arns ${POLICY_ARN} \
  --region ${AWS_REGION}
驗證關聯:
eksctl get podidentityassociation --cluster ${CLUSTER_NAME} --region ${AWS_REGION}
輸出應該包含 default 命名空間中的model-storage-sa關聯。
使用 model-storage-sa ServiceAccount 使用 AWS CLI 映像執行一次性 Pod,以確認 EKS Pod 身分已連接且 S3 存取正常運作:
cat << EOF | kubectl apply -f -
apiVersion: v1
kind: Pod
metadata:
  name: s3-test
  labels:
    guide: ai-eks-docs
spec:
  serviceAccountName: model-storage-sa
  containers:
    - name: aws-cli
      image: public.ecr.aws/aws-cli/aws-cli:2.27.0
      command:
        - sh
        - -c
        - |
          echo "=== Caller Identity ==="
          aws sts get-caller-identity
          echo ""
          echo "=== S3 Write Test ==="
          echo "pod identity works" | aws s3 cp - s3://${MODEL_BUCKET}/test.txt
          echo ""
          echo "=== S3 List Test ==="
          aws s3 ls s3://${MODEL_BUCKET}/
          echo ""
          echo "=== S3 Delete Test ==="
          aws s3 rm s3://${MODEL_BUCKET}/test.txt
  restartPolicy: Never
EOF
等待 Pod 完成並檢查日誌:
kubectl wait --for=jsonpath='{.status.phase}'=Succeeded pod/s3-test --timeout=300s
kubectl logs s3-test
預期的輸出結果:
=== Caller Identity ===
{
    "UserId": "AROA...:eks-ai-eks-docs-model-s-...",
    "Account": "123456789012",
    "Arn": "arn:aws:sts::123456789012:assumed-role/ai-eks-docs-model-storage-role/eks-ai-eks-docs-model-s-..."
}

=== S3 Write Test ===
upload: - to s3://ai-eks-docs-models-01234567/test.txt

=== S3 List Test ===
2026-05-04 12:00:00         19 test.txt

=== S3 Delete Test ===
delete: s3://ai-eks-docs-models-01234567/test.txt
發起人身分會確認 Pod 透過 EKS Pod 身分擔任該${CLUSTER_NAME}-model-storage-role角色。S3 命令會確認讀取和寫入存取。
清除測試 Pod:
kubectl delete pod s3-test
後續步驟
叢集準備就緒後,您可以繼續載入並提供模型,以部署大型語言模型並與推論端點互動。
清除
提示
如果您打算繼續本指南的下一節,請略過完整清除。只有在完成時才會執行它。
export CLUSTER_NAME=ai-eks-docs
export AWS_REGION=us-east-2
kubectl delete pod nvidia-smi --ignore-not-found
kubectl delete deployment gpu-overflow-test --ignore-not-found
如果您建立了 ODCR,請先取消它。查詢保留 ID:
INSTANCE_TYPE="g6e.4xlarge"
CAPACITY_RESERVATION_ID=$(aws ec2 describe-capacity-reservations \
  --filters "Name=state,Values=active" "Name=instance-type,Values=${INSTANCE_TYPE}" \
  --query 'CapacityReservations[0].CapacityReservationId' \
  --output text \
  --region ${AWS_REGION})
echo "Capacity reservation ID: ${CAPACITY_RESERVATION_ID}"
取消保留:
aws ec2 cancel-capacity-reservation --capacity-reservation-id ${CAPACITY_RESERVATION_ID}
重要
取消保留不會終止執行中的執行個體。它們會以標準隨需費率繼續,直到終止為止。取消之前,請先刪除部署以耗盡預留節點。
查詢 IAM 政策 ARN:
AMP_POLICY_ARN=$(aws iam list-policies \
  --scope Local \
  --query "Policies[?PolicyName=='${CLUSTER_NAME}-amp-grafana-policy'].Arn" \
  --output text)
echo "AMP Policy ARN: ${AMP_POLICY_ARN}"
查詢 AMP 工作區 ID:
AMP_WORKSPACE_ID=$(aws amp list-workspaces \
  --alias "amp-ws-${CLUSTER_NAME}" \
  --query 'workspaces[0].workspaceId' \
  --output text \
  --region ${AWS_REGION})
echo "AMP Workspace ID: ${AMP_WORKSPACE_ID}"
解除安裝 DCGM 匯出工具 Helm 版本:
helm uninstall dcgm-exporter -n monitoring
解除安裝 kube-prometheus-stack Helm 版本:
helm uninstall kube-prometheus-stack -n monitoring
刪除 Prometheus 擷取服務帳戶的 EKS Pod 身分關聯:
eksctl delete podidentityassociation \
  --cluster ${CLUSTER_NAME} \
  --namespace monitoring \
  --service-account-name amp-iamproxy-ingest-service-account \
  --region ${AWS_REGION}
刪除 Grafana 服務帳戶的 EKS Pod 身分關聯:
eksctl delete podidentityassociation \
  --cluster ${CLUSTER_NAME} \
  --namespace monitoring \
  --service-account-name grafana-sa \
  --region ${AWS_REGION}
刪除 Prometheus 和 Grafana 使用的 IAM 政策:
aws iam delete-policy --policy-arn ${AMP_POLICY_ARN}
刪除 AMP 工作區:
aws amp delete-workspace --workspace-id ${AMP_WORKSPACE_ID} --region ${AWS_REGION}
刪除監控命名空間:
kubectl delete namespace monitoring
查詢模型儲存貯體名稱:
MODEL_BUCKET=$(aws s3api list-buckets \
  --query "Buckets[?starts_with(Name, '${CLUSTER_NAME}-models-')].Name | [0]" \
  --output text)
echo "Model bucket: ${MODEL_BUCKET}"
查詢 IAM 政策 ARN:
POLICY_ARN=$(aws iam list-policies \
  --scope Local \
  --query "Policies[?PolicyName=='${CLUSTER_NAME}-model-storage-policy'].Arn" \
  --output text)
echo "Policy ARN: ${POLICY_ARN}"
刪除 S3 模型儲存貯體及其所有物件:
aws s3 rb s3://${MODEL_BUCKET} --force
刪除 EKS Pod 身分關聯:
eksctl delete podidentityassociation \
  --cluster ${CLUSTER_NAME} \
  --namespace default \
  --service-account-name model-storage-sa \
  --region ${AWS_REGION}
刪除 IAM 政策:
aws iam delete-policy --policy-arn ${POLICY_ARN}
刪除 Kubernetes ServiceAccount:
kubectl delete serviceaccount model-storage-sa
kubectl delete nodepool gpu-inf --ignore-not-found
kubectl delete nodeclass gpu-inf --ignore-not-found
kubectl delete ec2nodeclass gpu-inf --ignore-not-found
eksctl delete cluster --name=$CLUSTER_NAME --region=$AWS_REGION
