Generating an analysis with natural language prompts
With Quick Sight, you can generate multi-sheet analyses from natural language prompts. Describe the analysis you want, and Quick Sight creates multiple organized sheets with visuals, filter controls, and calculated fields such as year-over-year growth and month-over-month comparisons.
Before generation begins, you can review and modify an interactive plan that outlines the proposed structure.
The generated output is a native Quick Sight analysis. It works with existing publishing workflows, embedding patterns, CI/CD pipelines, and point-and-click editing in the analysis surface. After generation, you can refine each visual.
Prerequisites
To generate an analysis from a natural language prompt, you need the following:
-
An AWS account
-
Amazon Quick Enterprise Edition with at least one Author Pro user
-
At least one dataset in your Quick Sight account
Generating an analysis
Use the following procedure to generate an analysis from a natural language prompt.
To generate an analysis from a natural language prompt
-
Do one of the following:
-
Open a dataset and choose Generate analysis.
-
From the Analyses page, choose Generate analysis.

-
-
Choose Add data to select one to three datasets for the analysis. If your data spans multiple tables (for example, orders in one dataset and products in another), you can select them together.


-
Enter a natural language prompt that describes the analysis that you want to create. You can describe the business questions that you want answered, the metrics that you care about, and how you want the information organized across sheets.
Example prompt:
"Create an operations dashboard showing order volume trends, revenue KPIs, delivery performance comparing estimated vs actual delivery dates, and product category breakdown by revenue and order count. Include calculated fields for total revenue, average order value, and month-over-month order growth."

-
Do one of the following:
-
Choose Generate analysis to begin generation immediately.
-
Choose Preview analysis outline to review an outline first.
-
-
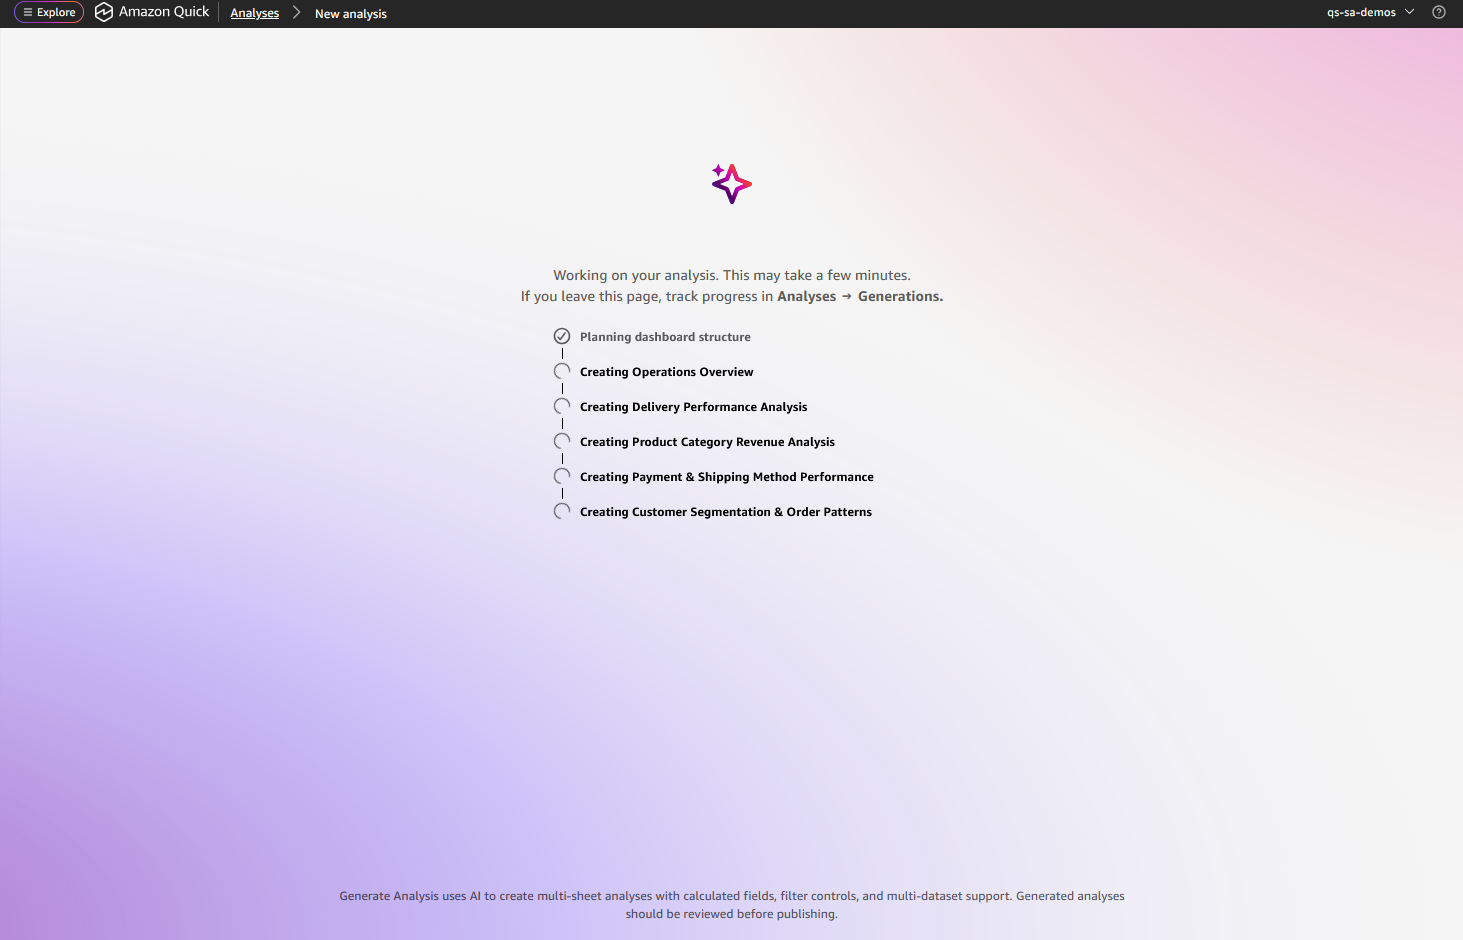
Wait while Quick Sight analyzes your dataset structure and column statistics. Real-time progress updates display the current status.

Note
If you navigate away from the progress screen, you can check the generation status on the Analyses page by choosing the Generations tab. Choose the generation name to return to the progress screen.

-
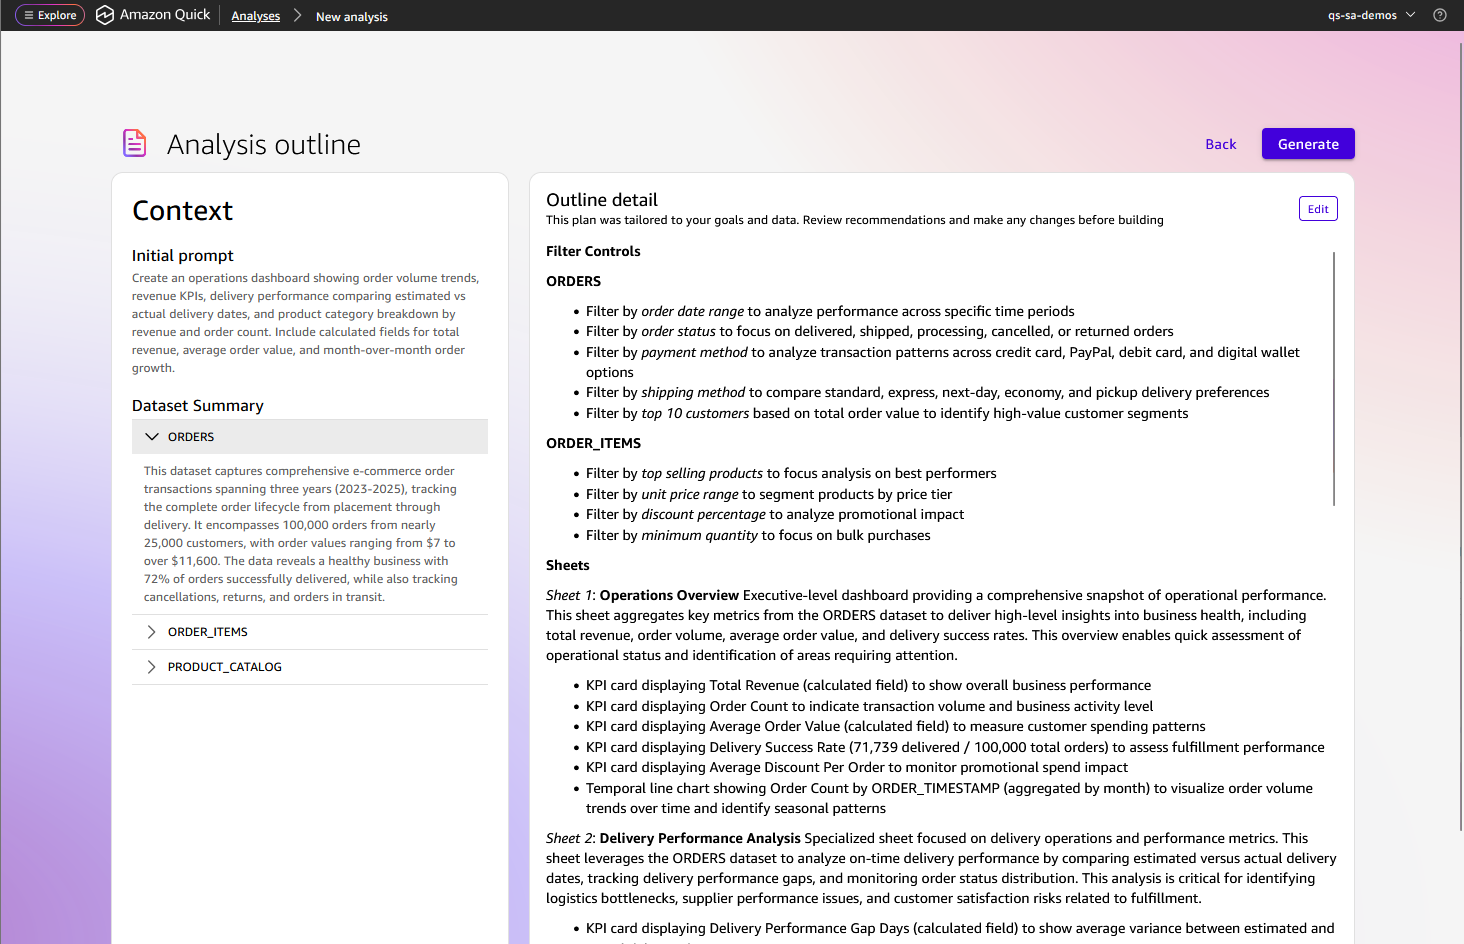
Quick Sight presents a two-pane view:
-
The left pane shows your initial prompt and a summary of the selected datasets.
-
The right pane shows the proposed filter controls, sheets, and visuals planned for each sheet.
You can edit sheet names, add or remove visuals, adjust the plan, and refine the prompt before generating.
-
-
Choose Generate. Real-time progress updates display the current status. Generation takes 2 to 5 minutes depending on the number of sheets and visuals.

Publishing a generated analysis
After you are satisfied with the generated analysis, choose Publish to create a dashboard.
You can share the dashboard with other users, embed it in applications, or schedule email deliveries. For more information about publishing and sharing, see Publishing dashboards and Sharing Quick Sight analyses.

