Application monitoring
Application monitoring provides a real-time view of how your services are performing. It combines topology data stored in OpenSearch with time-series RED metrics (Rate, Errors, Duration) from Amazon Managed Service for Prometheus to surface health, latency, throughput, and error information across your distributed system.
To access application monitoring, in OpenSearch UI navigate to Observability > Application Monitoring. The sidebar shows two views:
-
Application Map – Interactive topology graph of service dependencies
-
Services – Catalog of all instrumented services with filtering, detail views, and correlation links
Prerequisites
Before you can use application monitoring, you must have the following resources configured.
-
OTLP trace data flowing from your OTel Collectors to OpenSearch Ingestion (metrics and logs are optional)
-
Amazon Managed Service for Prometheus configured to receive remote write from OpenSearch Ingestion
-
An OpenSearch UI workspace with Observability enabled
How it works
The following diagram shows the end-to-end architecture for application monitoring.
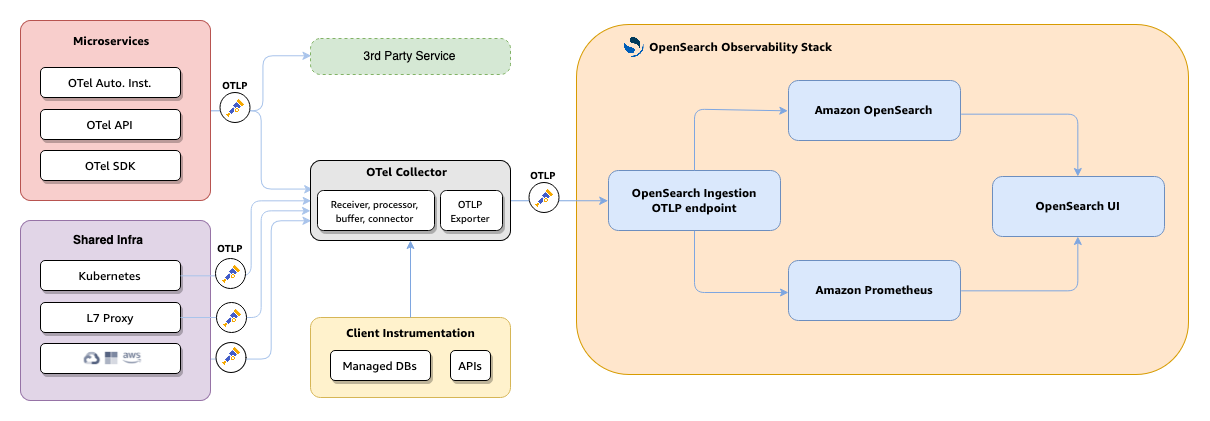
-
Your applications and infrastructure emit telemetry through OpenTelemetry SDKs, auto-instrumentation, or the OTel API to the OTel Collector.
-
The OTel Collector forwards trace data to OpenSearch Ingestion over OTLP.
-
The OpenSearch Ingestion
otel_apm_service_mapprocessor extracts service-to-service relationships and computes RED metrics. -
Topology and raw trace data are indexed into OpenSearch. RED metrics are exported to Amazon Managed Service for Prometheus through remote write.
-
OpenSearch UI queries both stores to render the Application Map, Services catalog, and service detail views.
Services
The Services view provides a centralized catalog of all instrumented services, displaying RED metrics (Rate, Errors, Duration) at a glance. You can use this view to quickly identify unhealthy services and drill into detail views for deeper analysis.
To access the Services view, navigate to the Observability workspace in OpenSearch UI and choose APM > Services.
The Services home page displays a table of all instrumented services along with summary panels. The following image shows the Services home page.
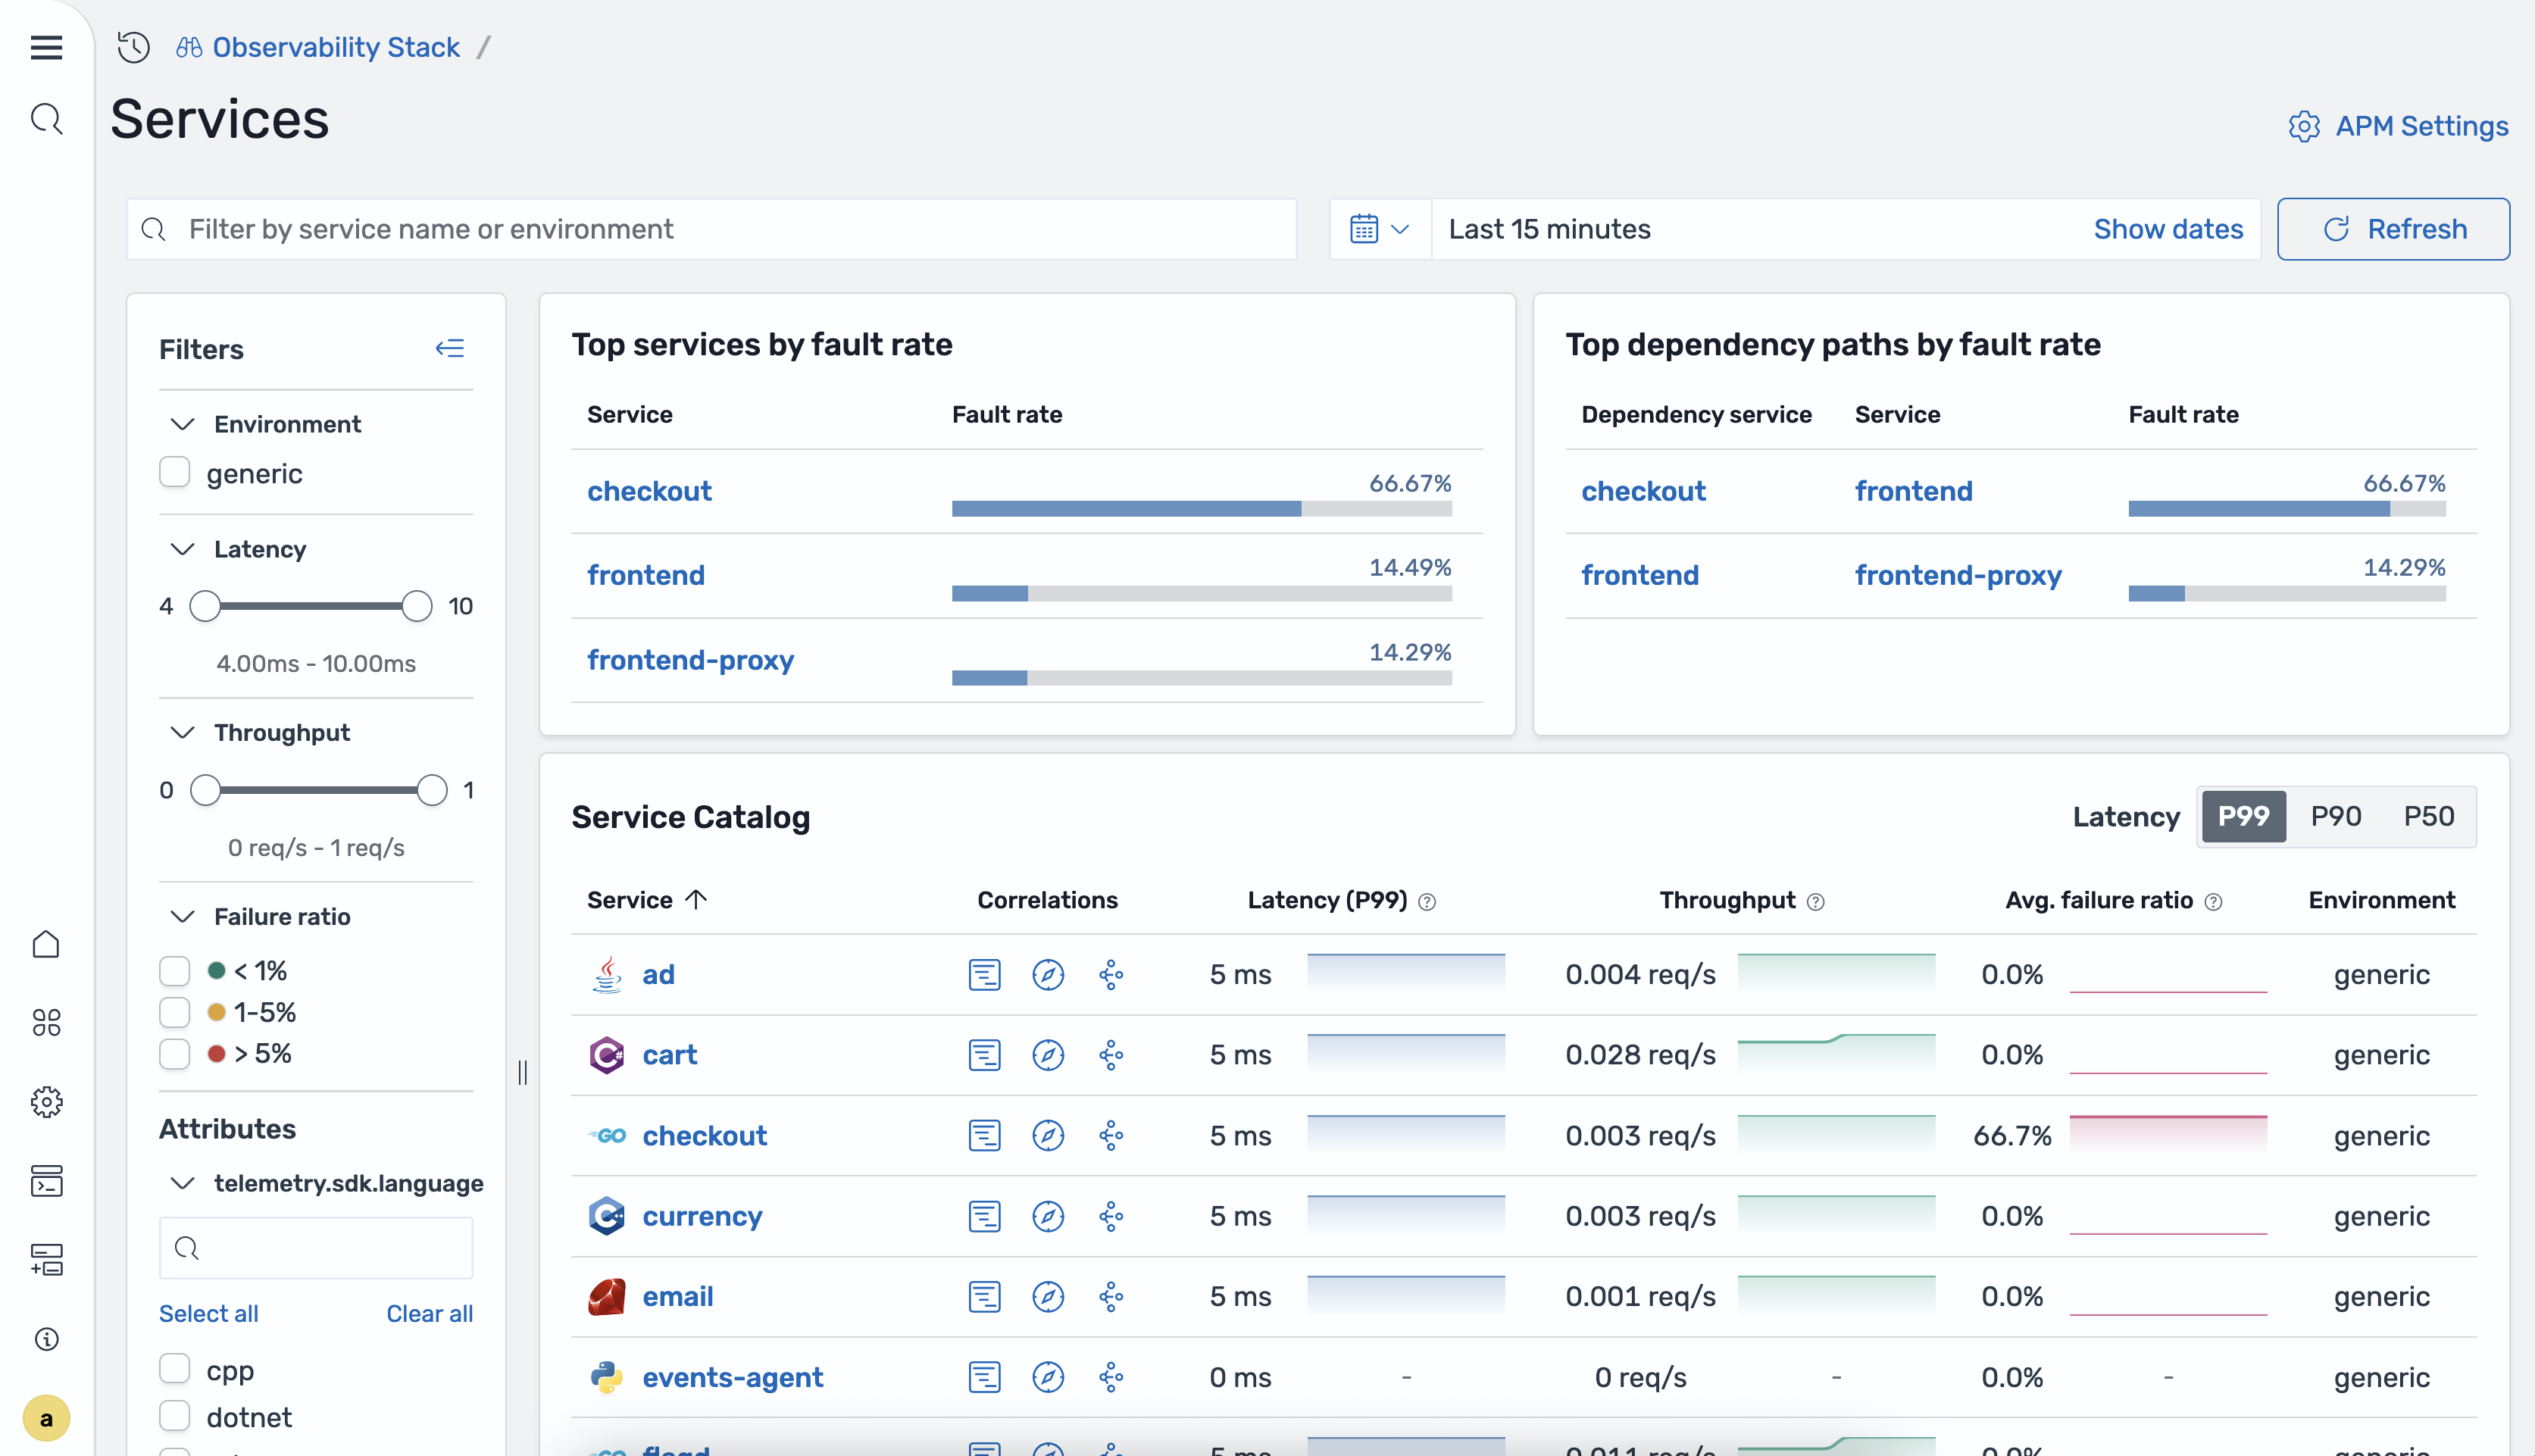
The following table describes the columns in the services table.
| Column | Description |
|---|---|
| Service name | The name of the instrumented service. |
| P99 latency | The 99th percentile latency for the service. |
| P90 latency | The 90th percentile latency for the service. |
| P50 latency | The 50th percentile (median) latency for the service. |
| Total requests | The total number of requests processed during the selected time range. |
| Failure ratio | The ratio of failed requests to total requests. |
| Environment | The deployment environment of the service, such as
production or staging. |
The home page also includes the following summary panels:
-
Top services by fault rate – Services with the highest percentage of 5xx responses.
-
Top dependency paths by fault rate – Service-to-service dependency paths with the highest fault rates.
You can filter the services table by using the following filters:
-
Environment – Filter by deployment environment.
-
Latency – Filter by latency range.
-
Throughput – Filter by request throughput range.
-
Failure ratio – Filter by failure ratio range.
Service overview
To open the service detail view, select a service name in the services table. The Overview tab displays metric tiles and time-series charts for the selected service.
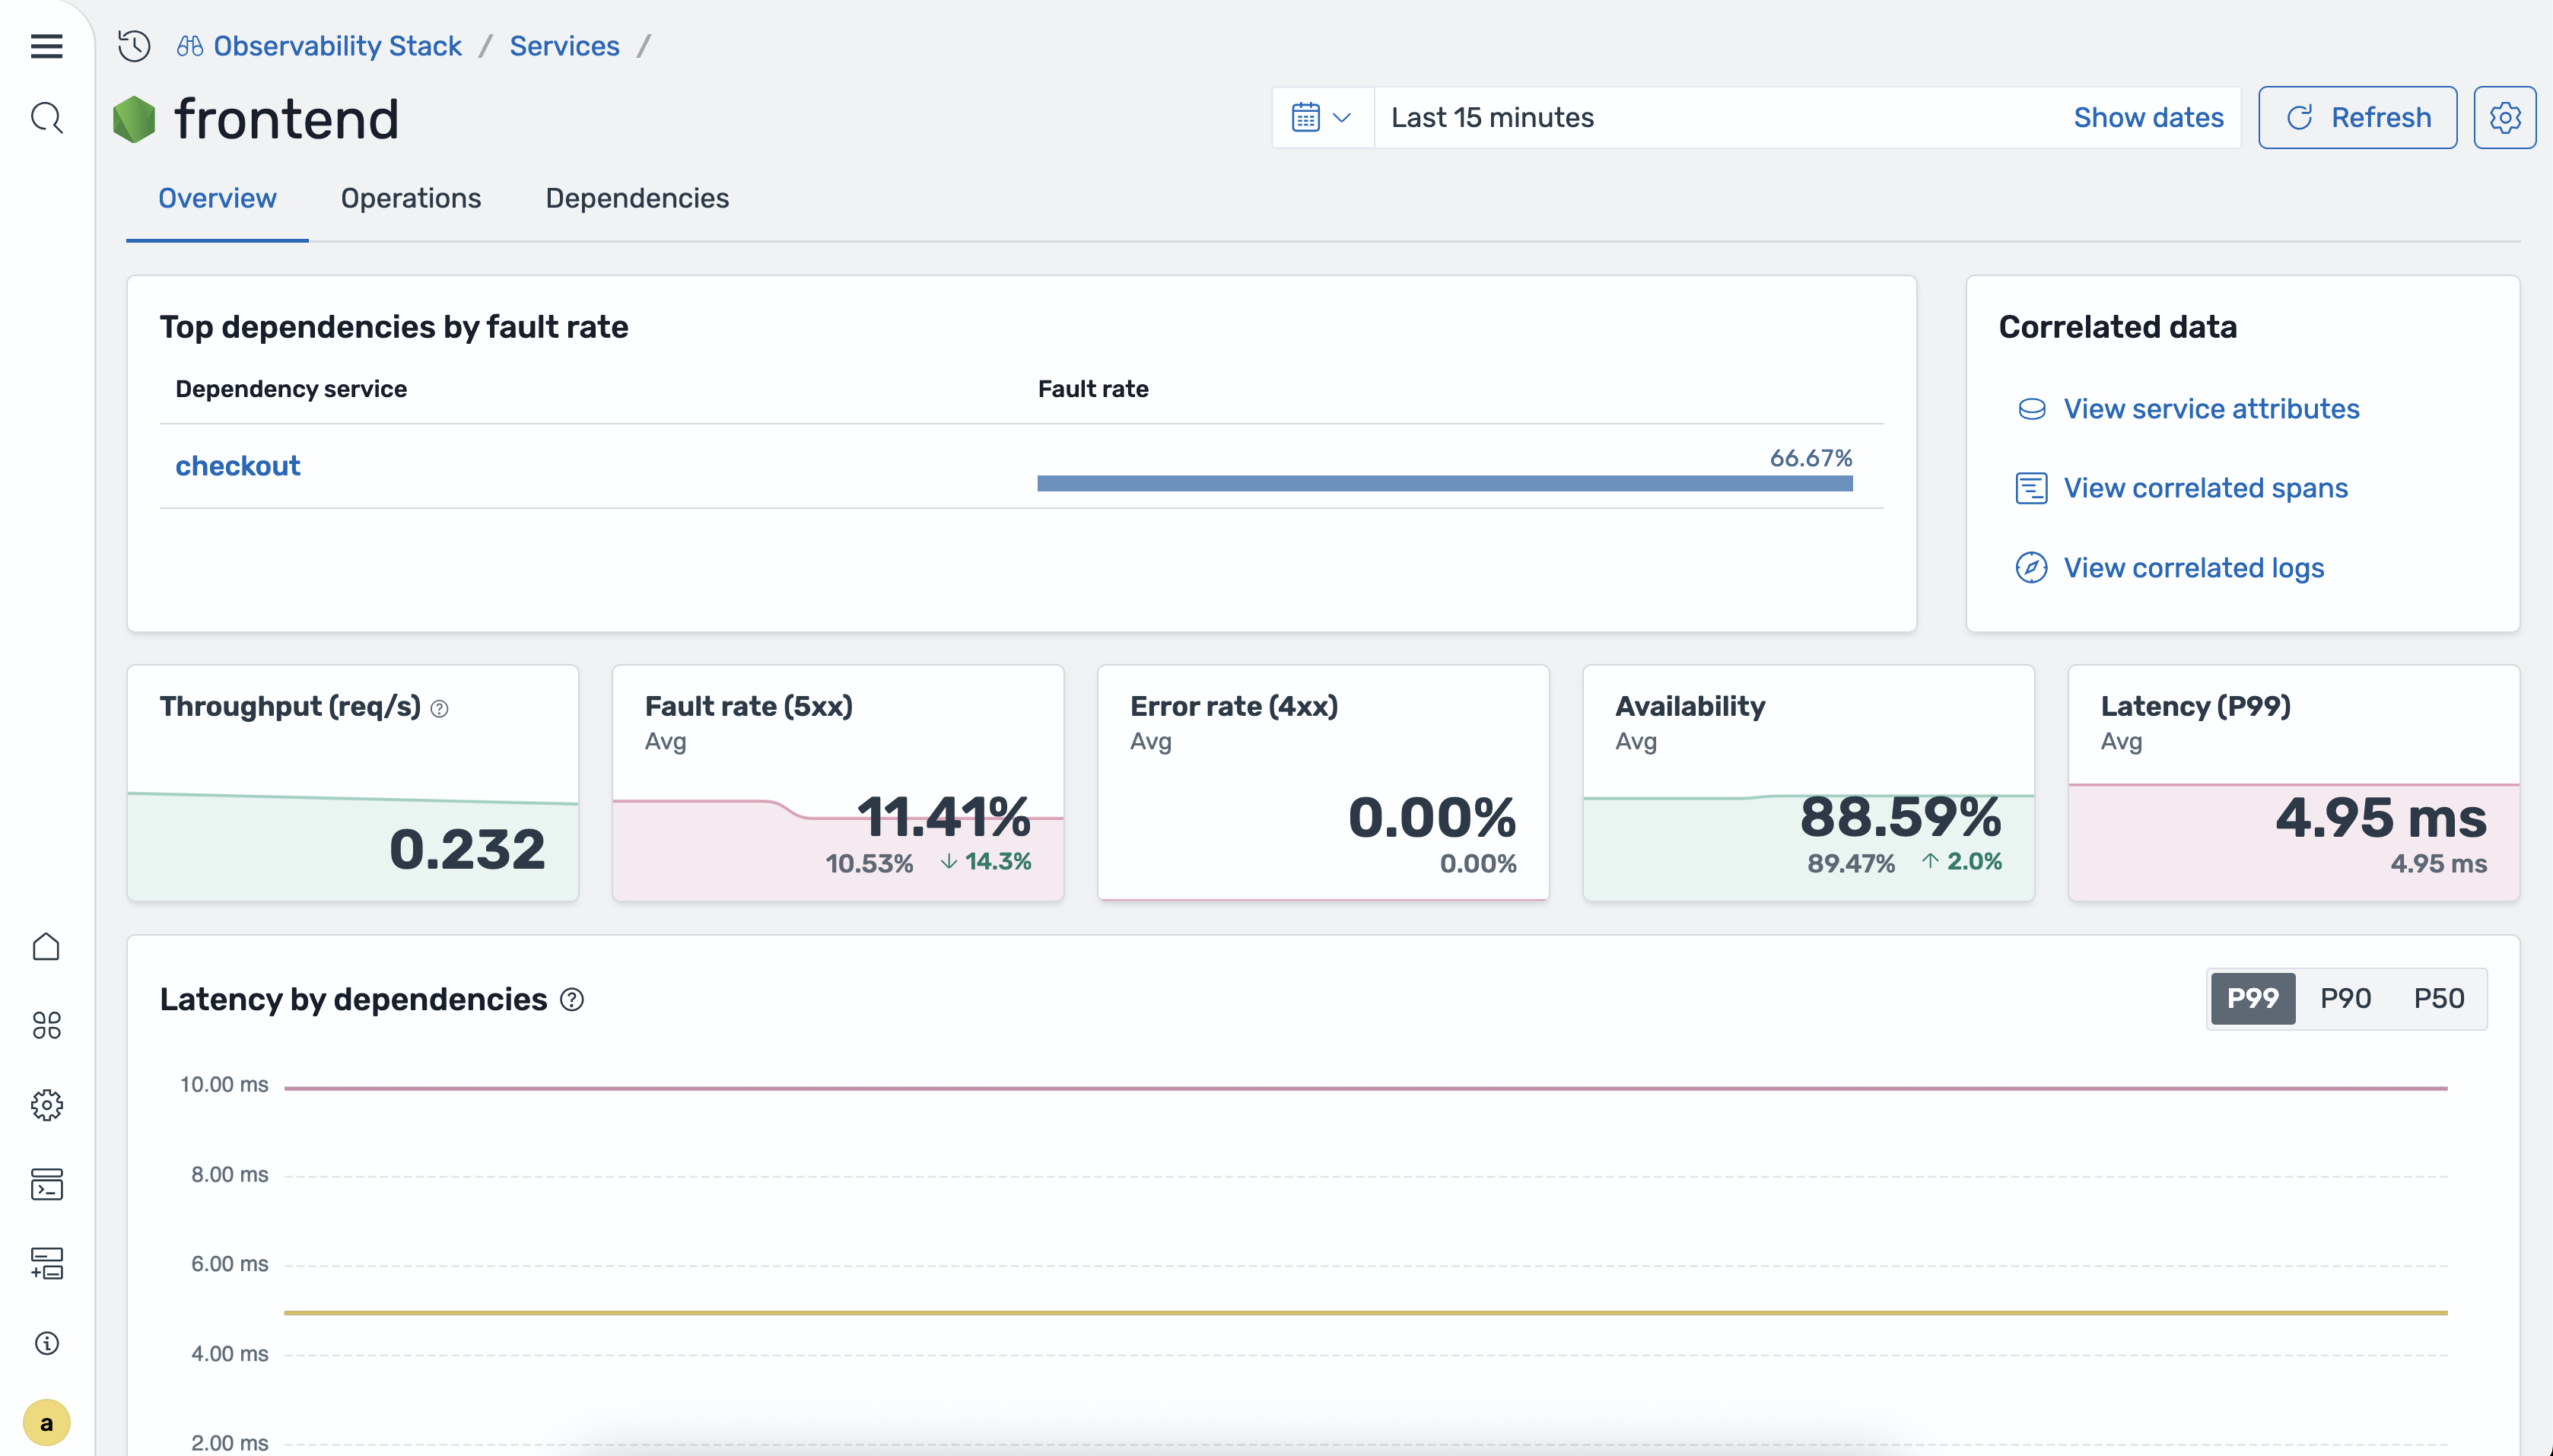
The Overview tab includes the following time-series charts:
-
Latency by service dependencies – P50, P90, and P99 latency broken down by downstream dependencies.
-
Requests by operations – Request volume for each operation of the service.
-
Availability by operations – Percentage of successful responses for each operation.
-
Fault rate and error rate by operations – Percentage of 5xx and 4xx responses for each operation.
Operations
The Operations tab provides a per-operation breakdown for the selected service. You can sort the table by any column to identify problematic operations.
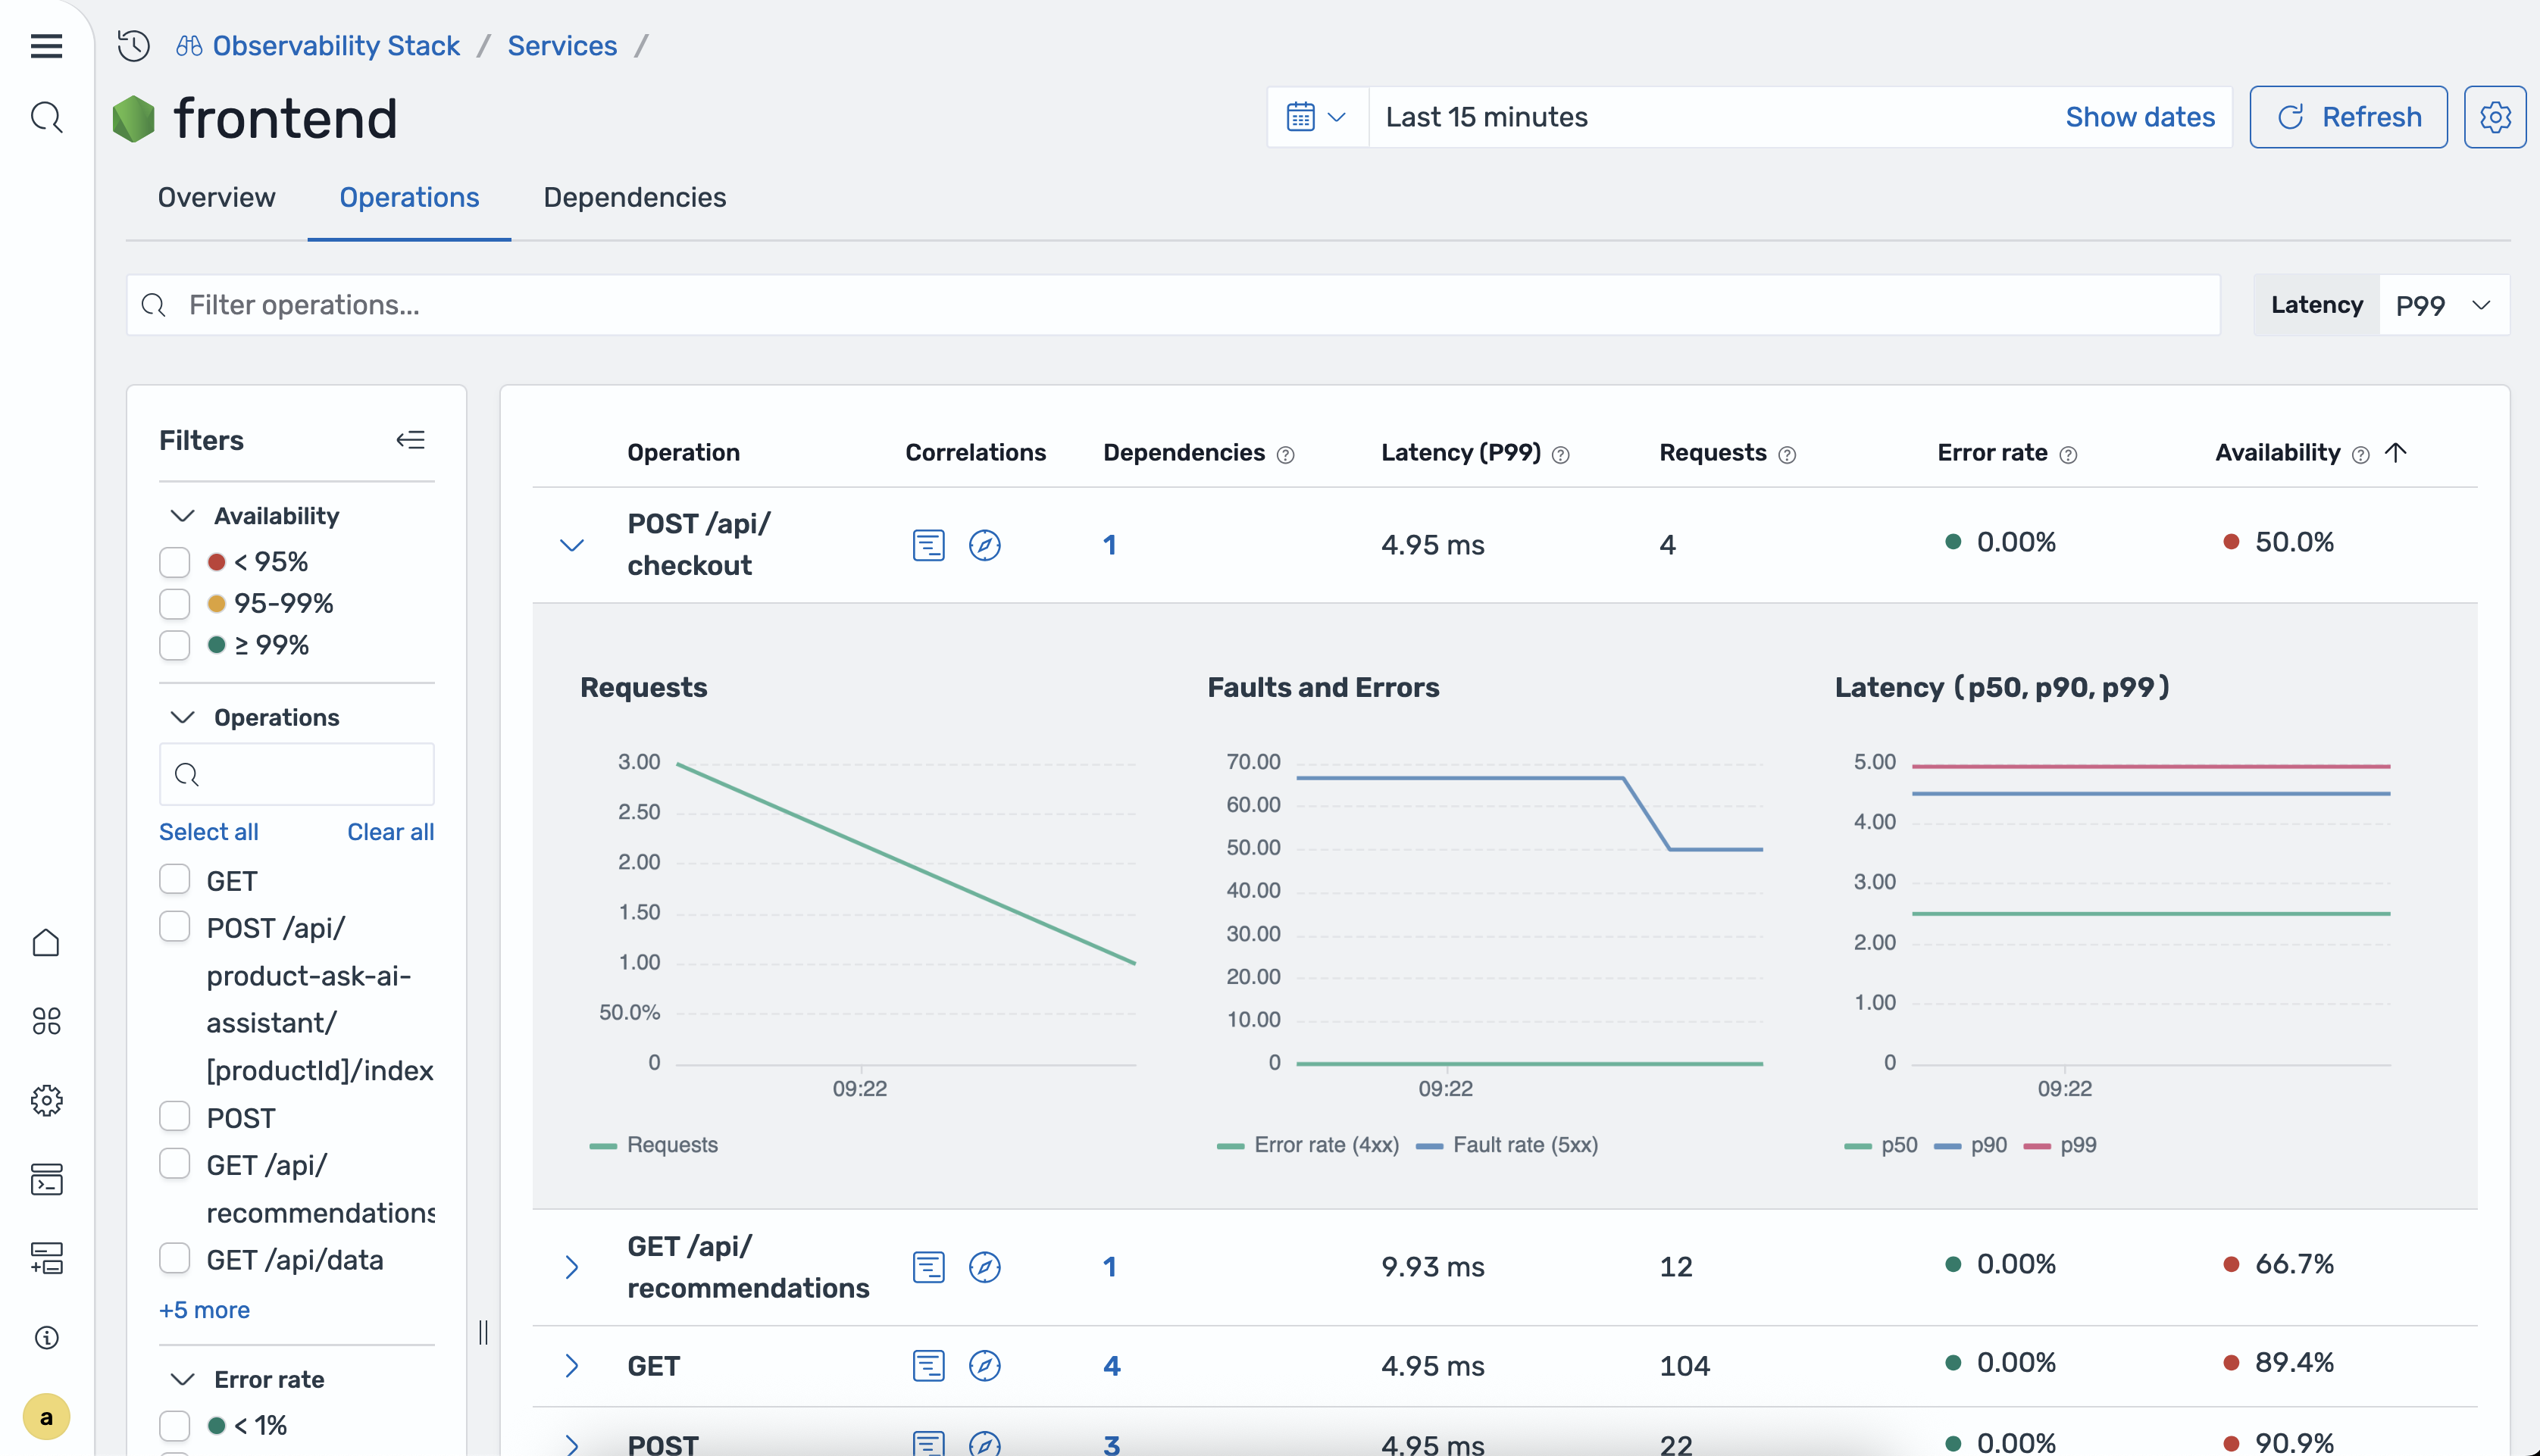
The following table describes the columns in the operations table.
| Column | Description |
|---|---|
| Operation name | The name of the operation. |
| P50/P90/P99 latency | The 50th, 90th, and 99th percentile latency for the operation. |
| Total requests | The total number of requests for the operation during the selected time range. |
| Error rate | The percentage of requests that returned errors. |
| Availability | The percentage of successful responses for the operation. |
Dependencies
The Dependencies tab displays the downstream services that the selected service calls.
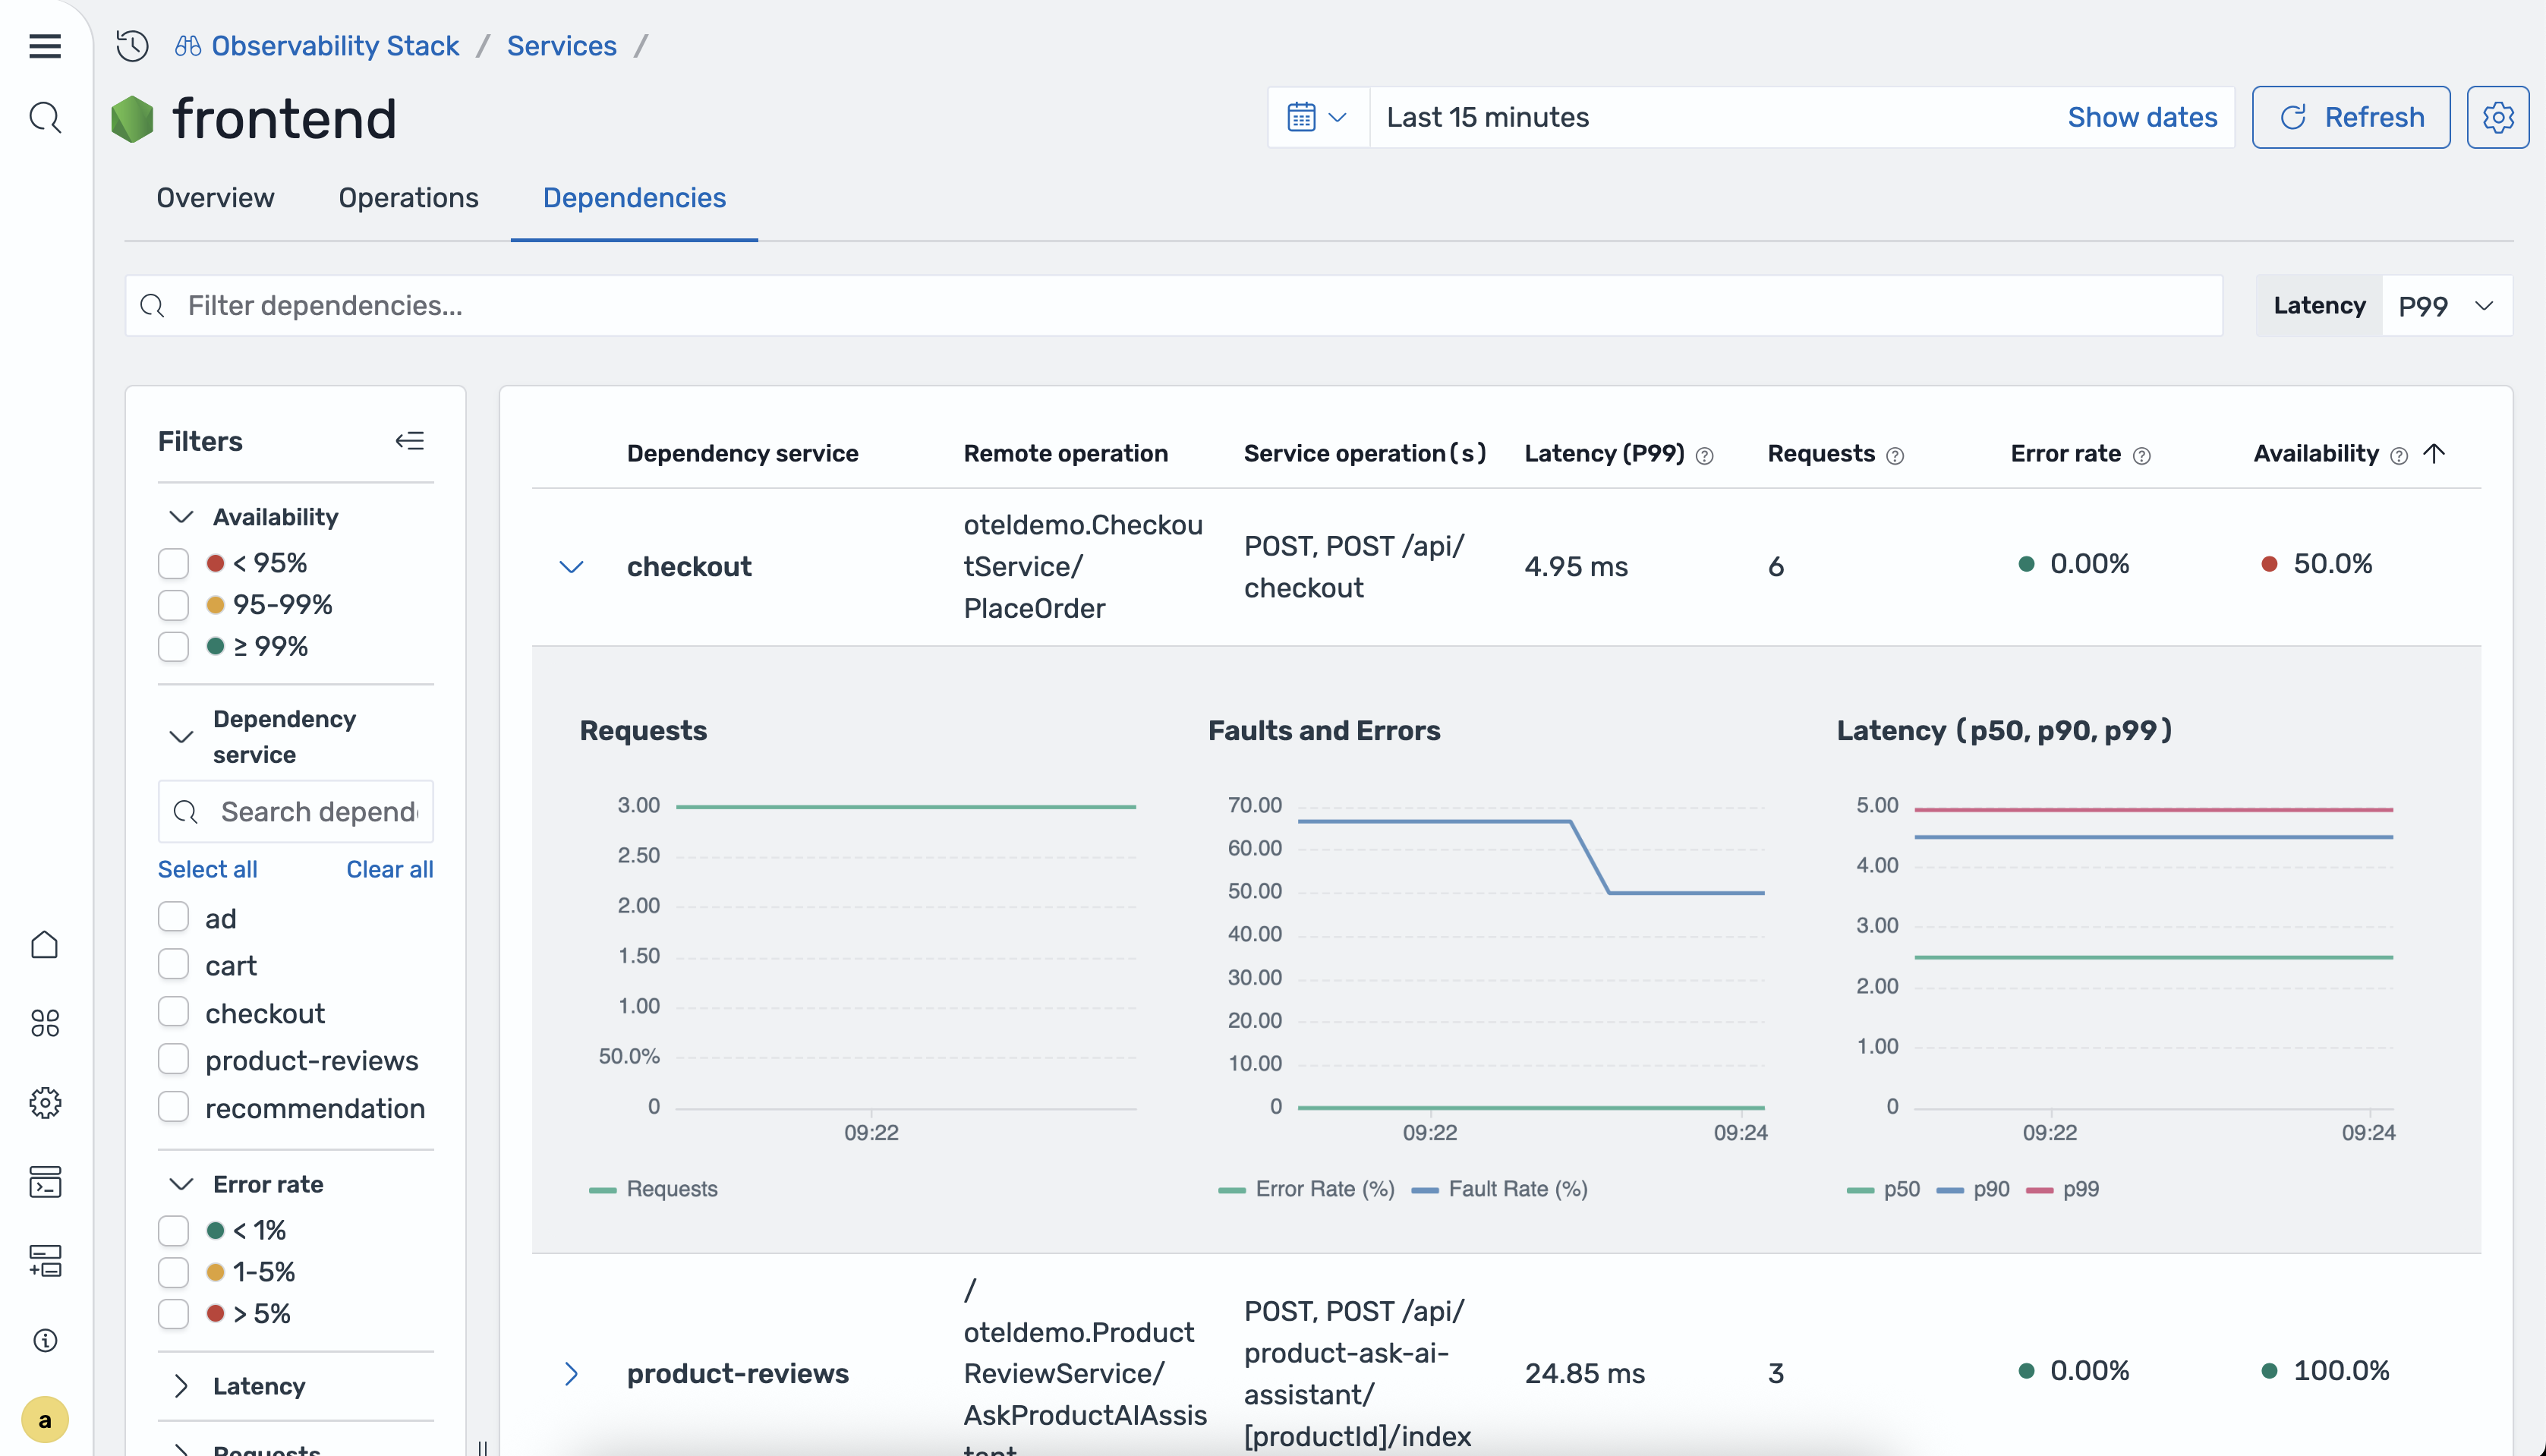
The following table describes the columns in the dependencies table.
| Column | Description |
|---|---|
| Dependency service | The name of the downstream service. |
| Remote operation | The operation called on the downstream service. |
| Service operations | The operations on the current service that call this dependency. |
| P99/P90/P50 latency | The 99th, 90th, and 50th percentile latency for the dependency path. |
| Total requests | The total number of requests to the dependency during the selected time range. |
| Error rate | The percentage of requests to the dependency that returned errors. |
| Availability | The percentage of successful responses from the dependency. |
Correlations
The service detail view provides in-context correlations that let you navigate from service metrics directly to related traces and logs. You can use correlations to investigate the root cause of latency spikes or error rate increases.
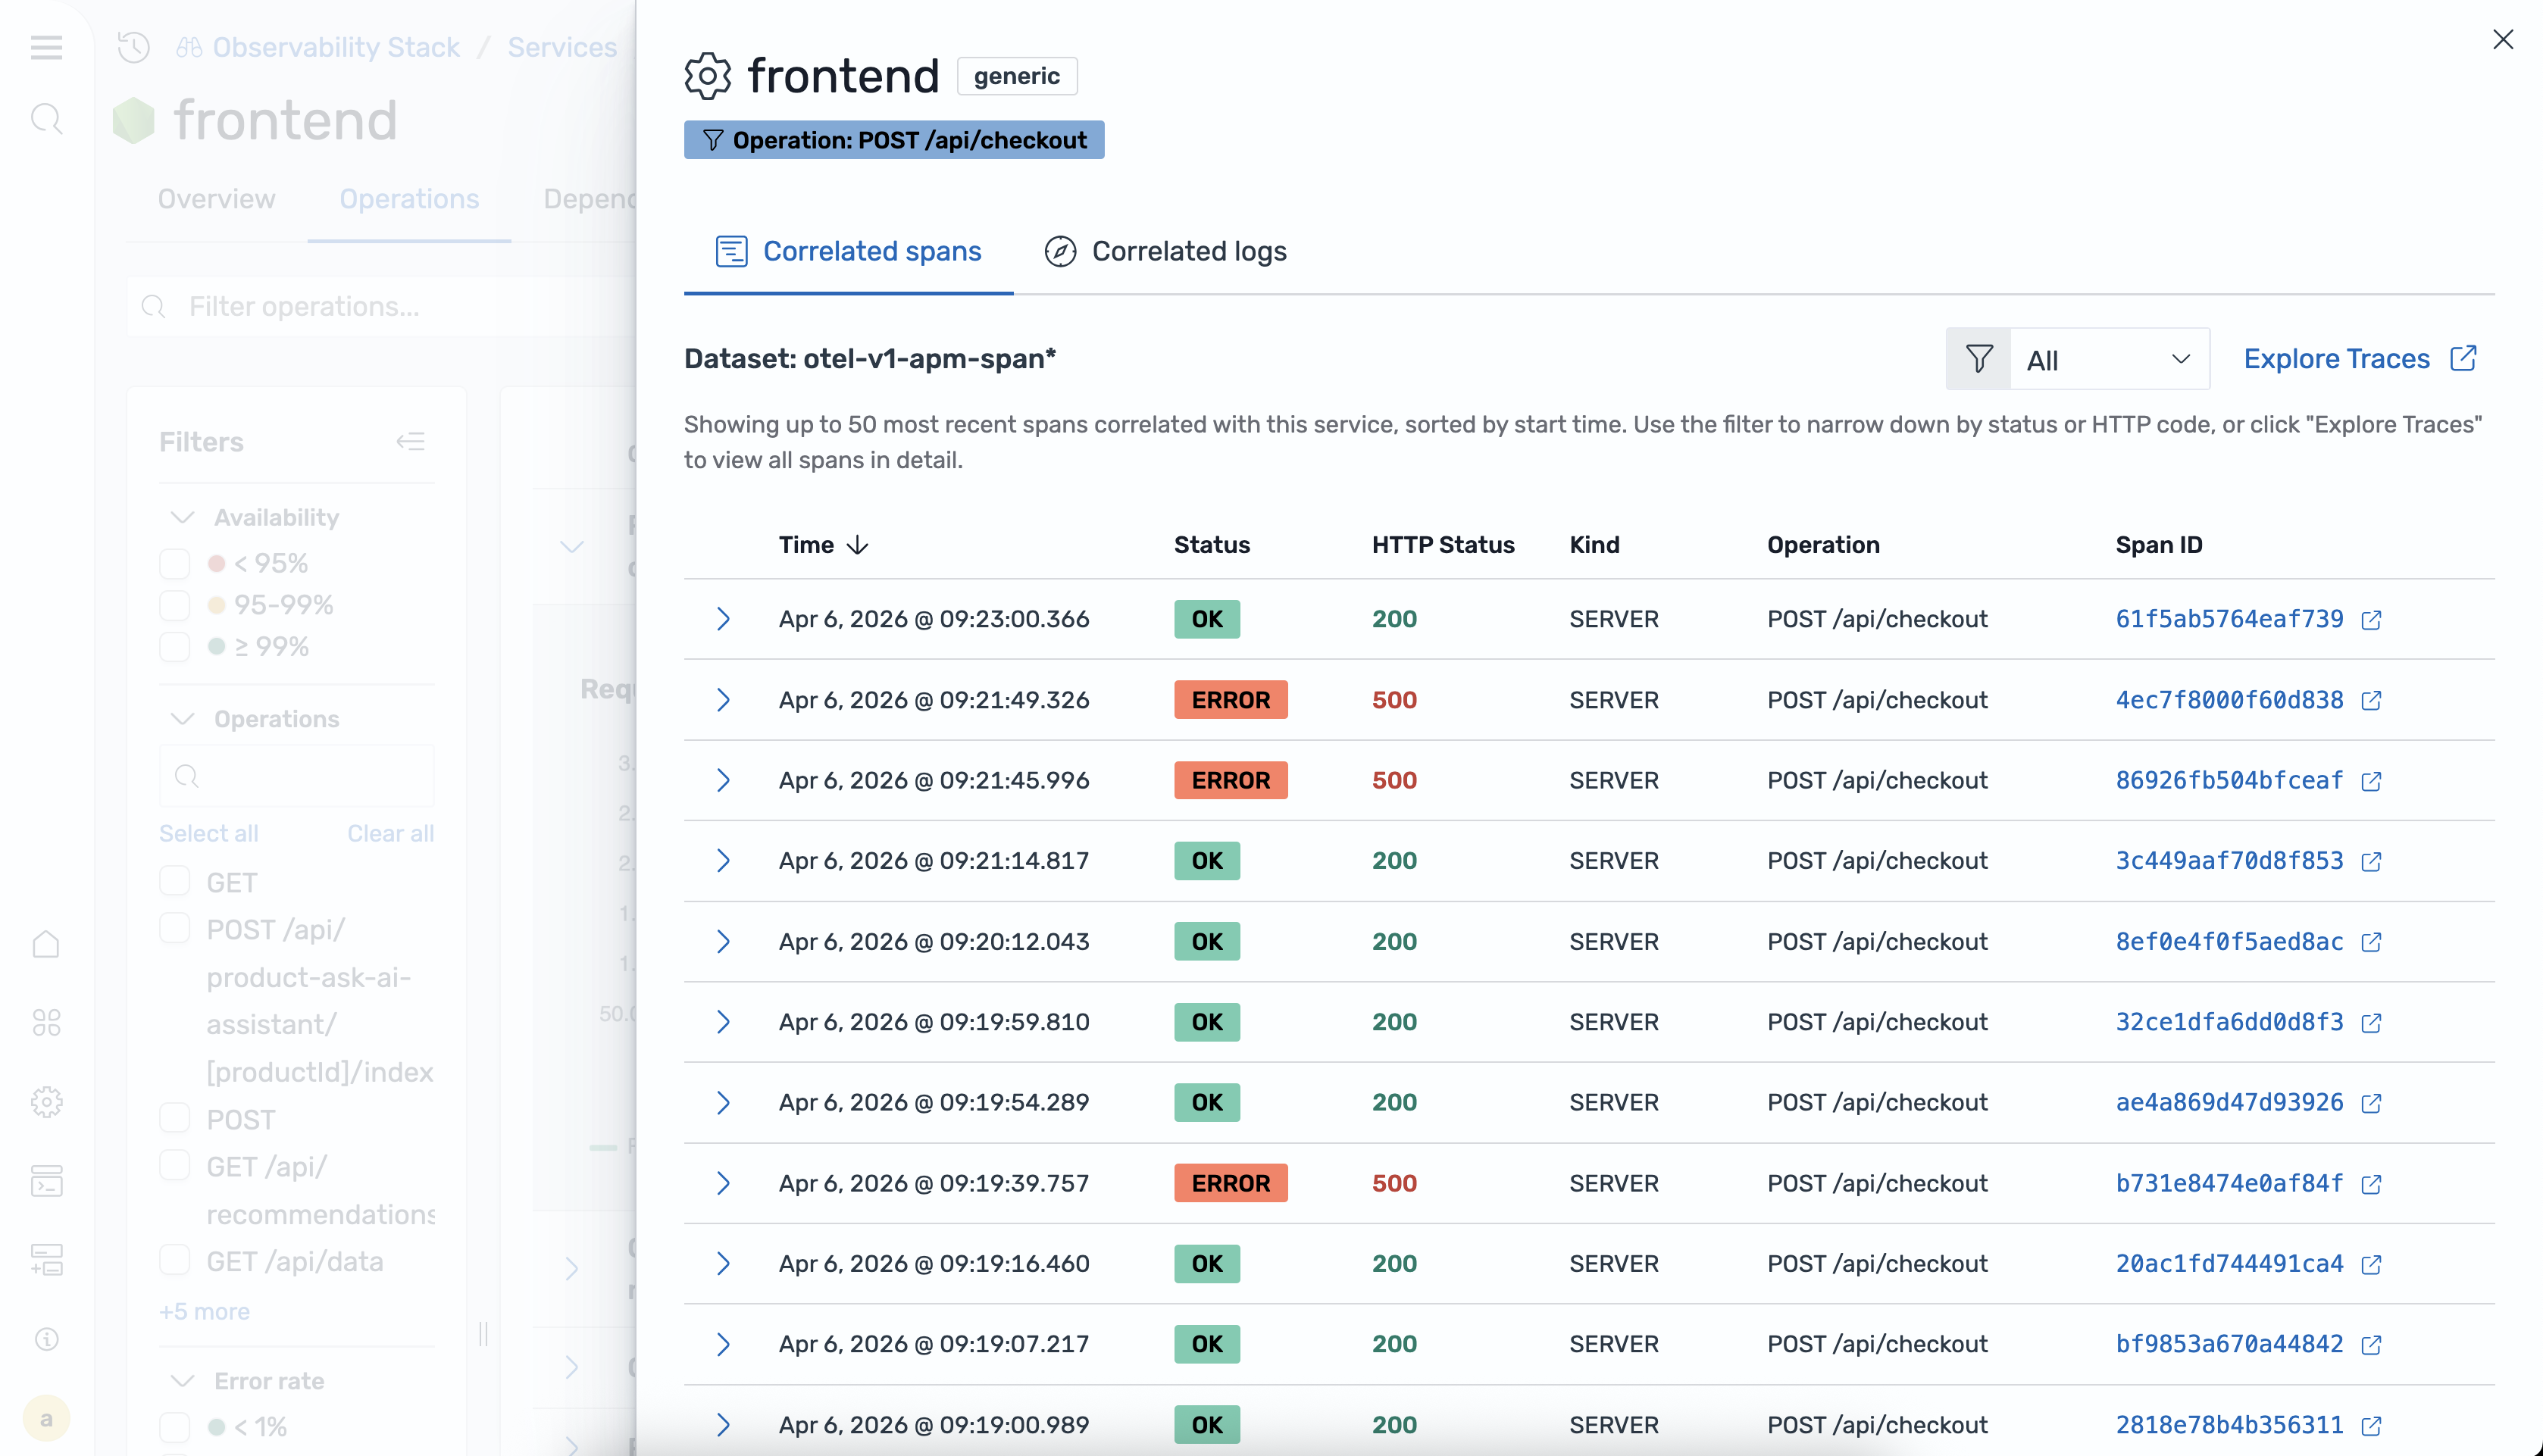
The following correlation options are available:
-
View related traces – Opens a filtered trace view for the selected service or operation.
-
View related logs – Opens a filtered log view for the selected service or operation.
-
Filter by attributes – Narrows correlation results by specific span attributes.
Application Map
The Application Map is an interactive topology visualization that OpenSearch Ingestion
auto-generates from your trace data by using the
otel_apm_service_map processor. The map displays services as nodes
with directional edges that show communication patterns, overlaid with RED metrics
(Rate, Errors, Duration).
To access the Application Map, navigate to the Observability workspace in OpenSearch UI and choose APM > Application map.
The following image shows the Application Map.
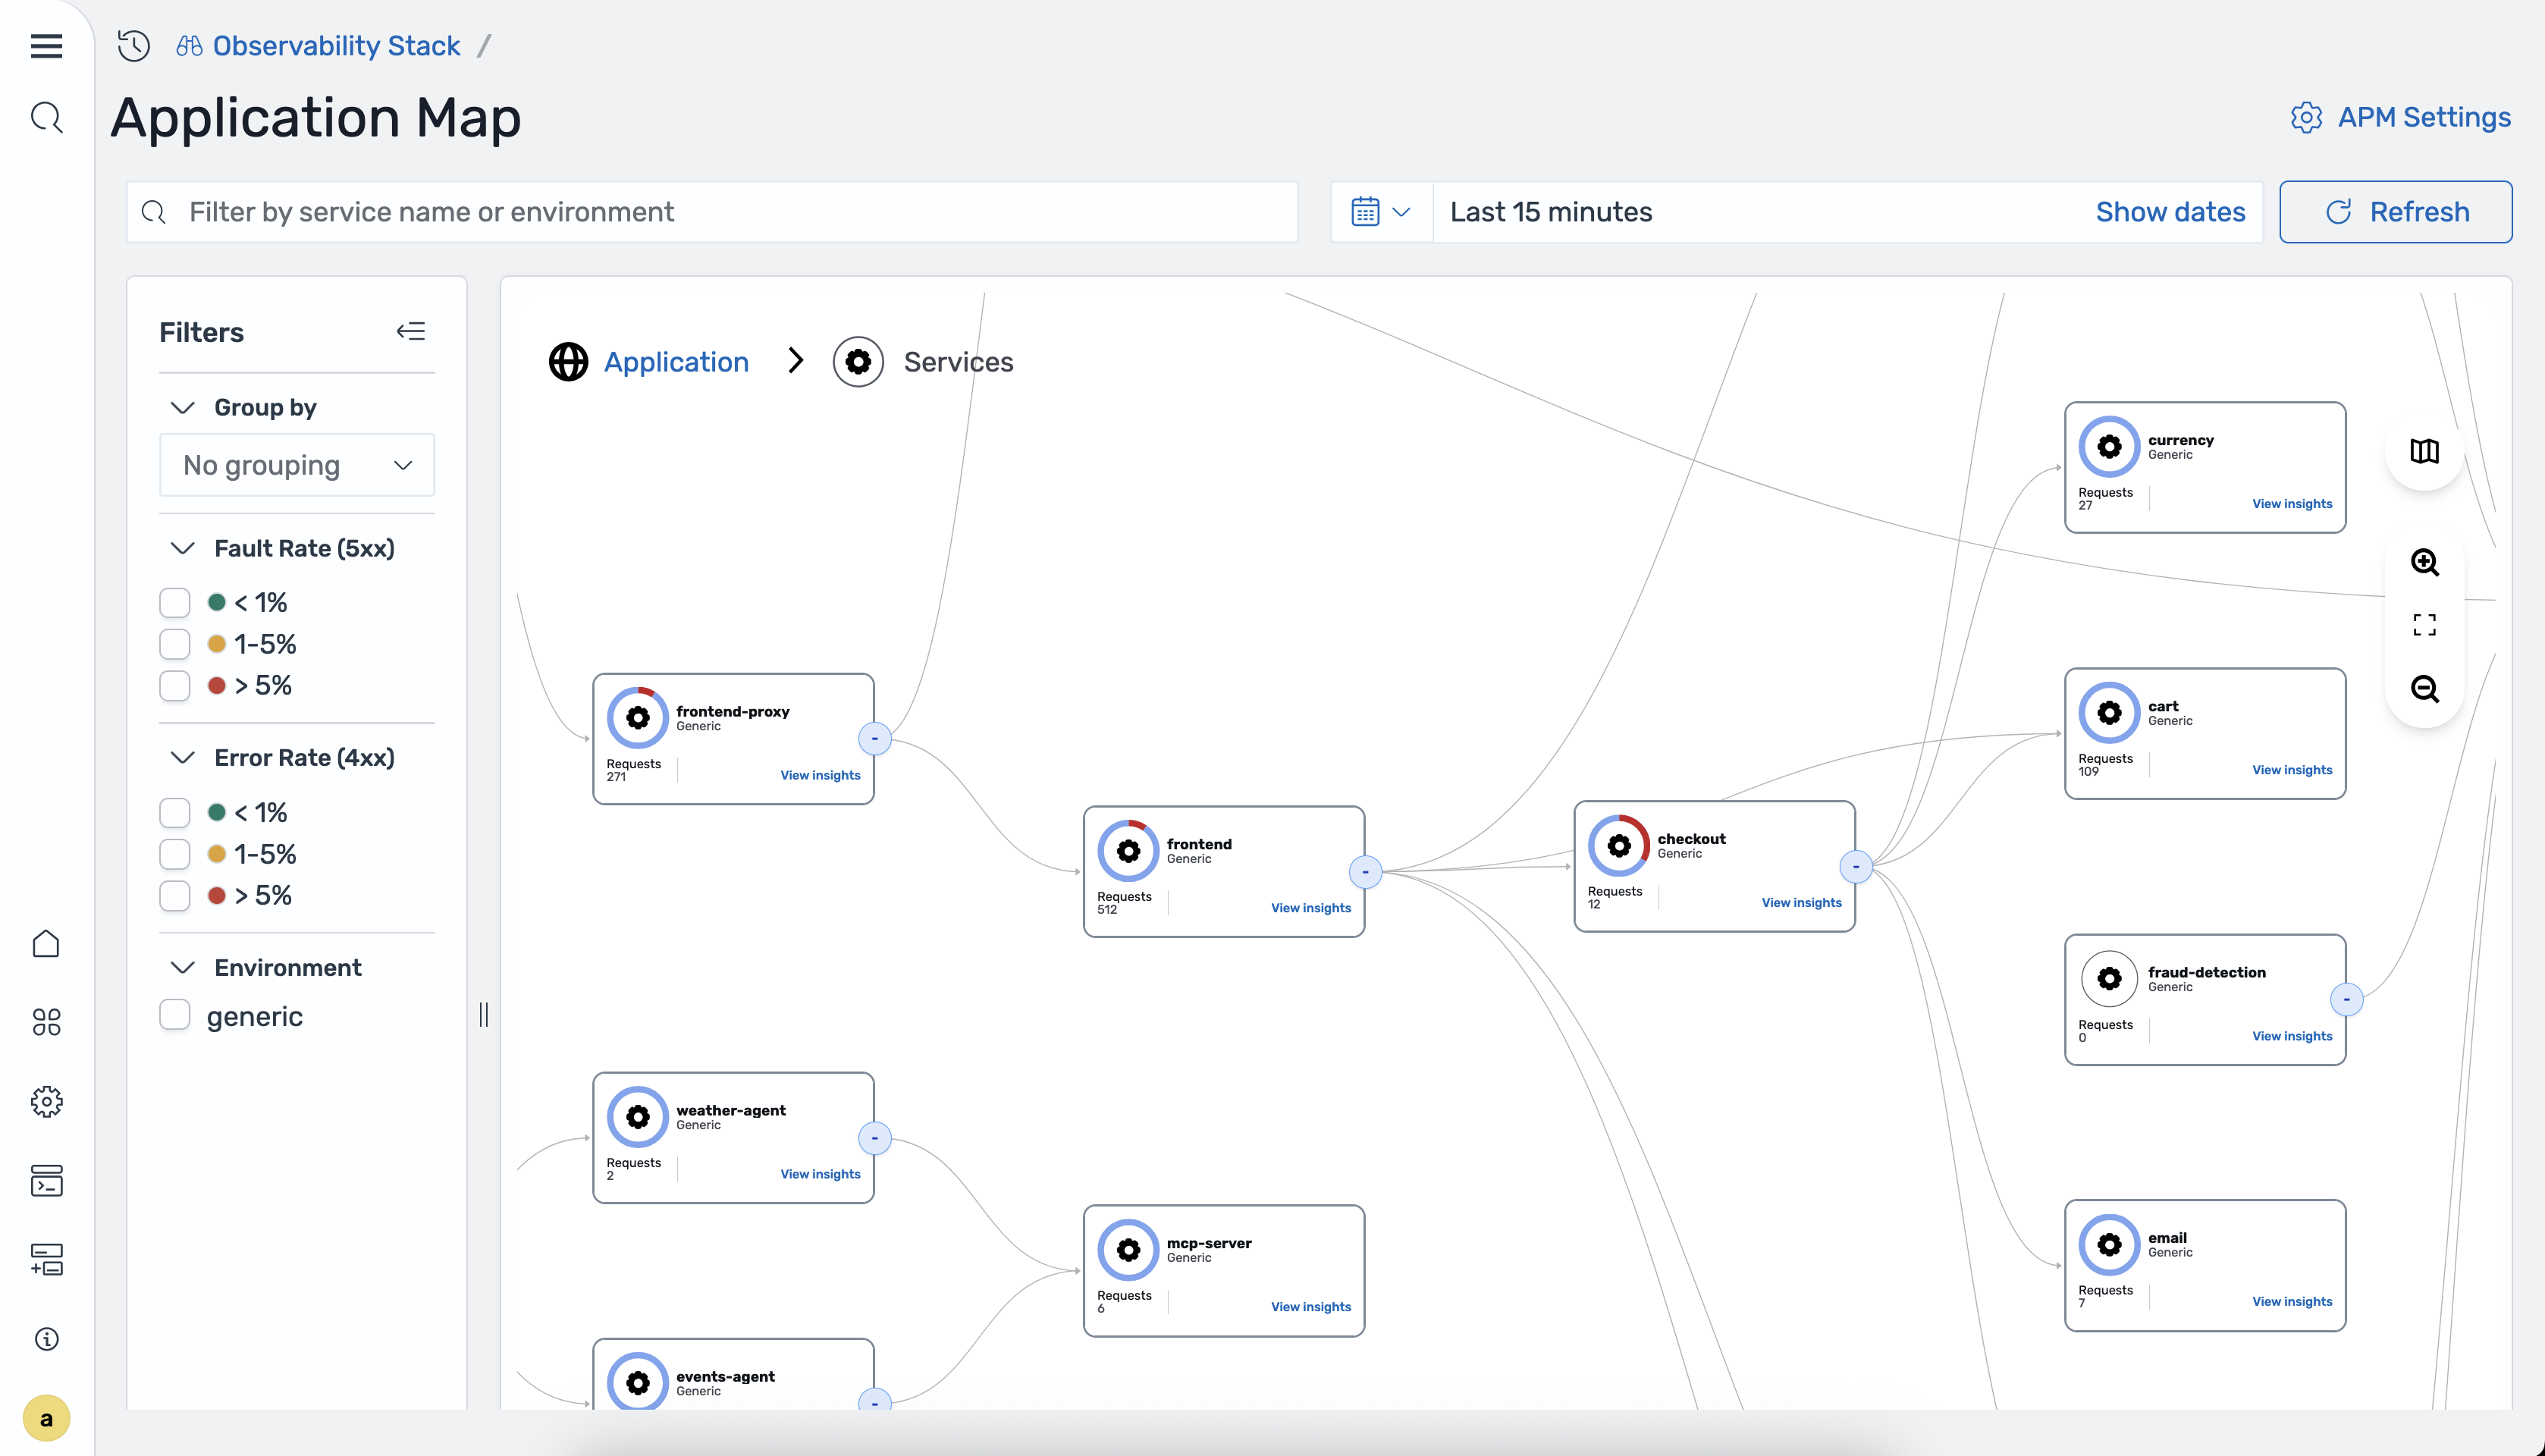
The map displays the following RED metrics for each service:
-
Rate – Requests per second processed by the service.
-
Errors – Percentage of 4xx and 5xx responses.
-
Duration – P50 and P99 latency for the service.
The otel_apm_service_map processor generates these metrics and
stores them in Amazon Managed Service for Prometheus through remote write.
The topology visualization represents services as nodes and communication direction as edges. Color coding indicates the health status of each service. The map updates automatically as OpenSearch Ingestion ingests new trace data.
Grouping services
You can group services by attributes such as programming language, team, or environment. When you select a group-by attribute, the map switches from a topology graph to a card grid view. Each card represents a group of services that share the same attribute value.
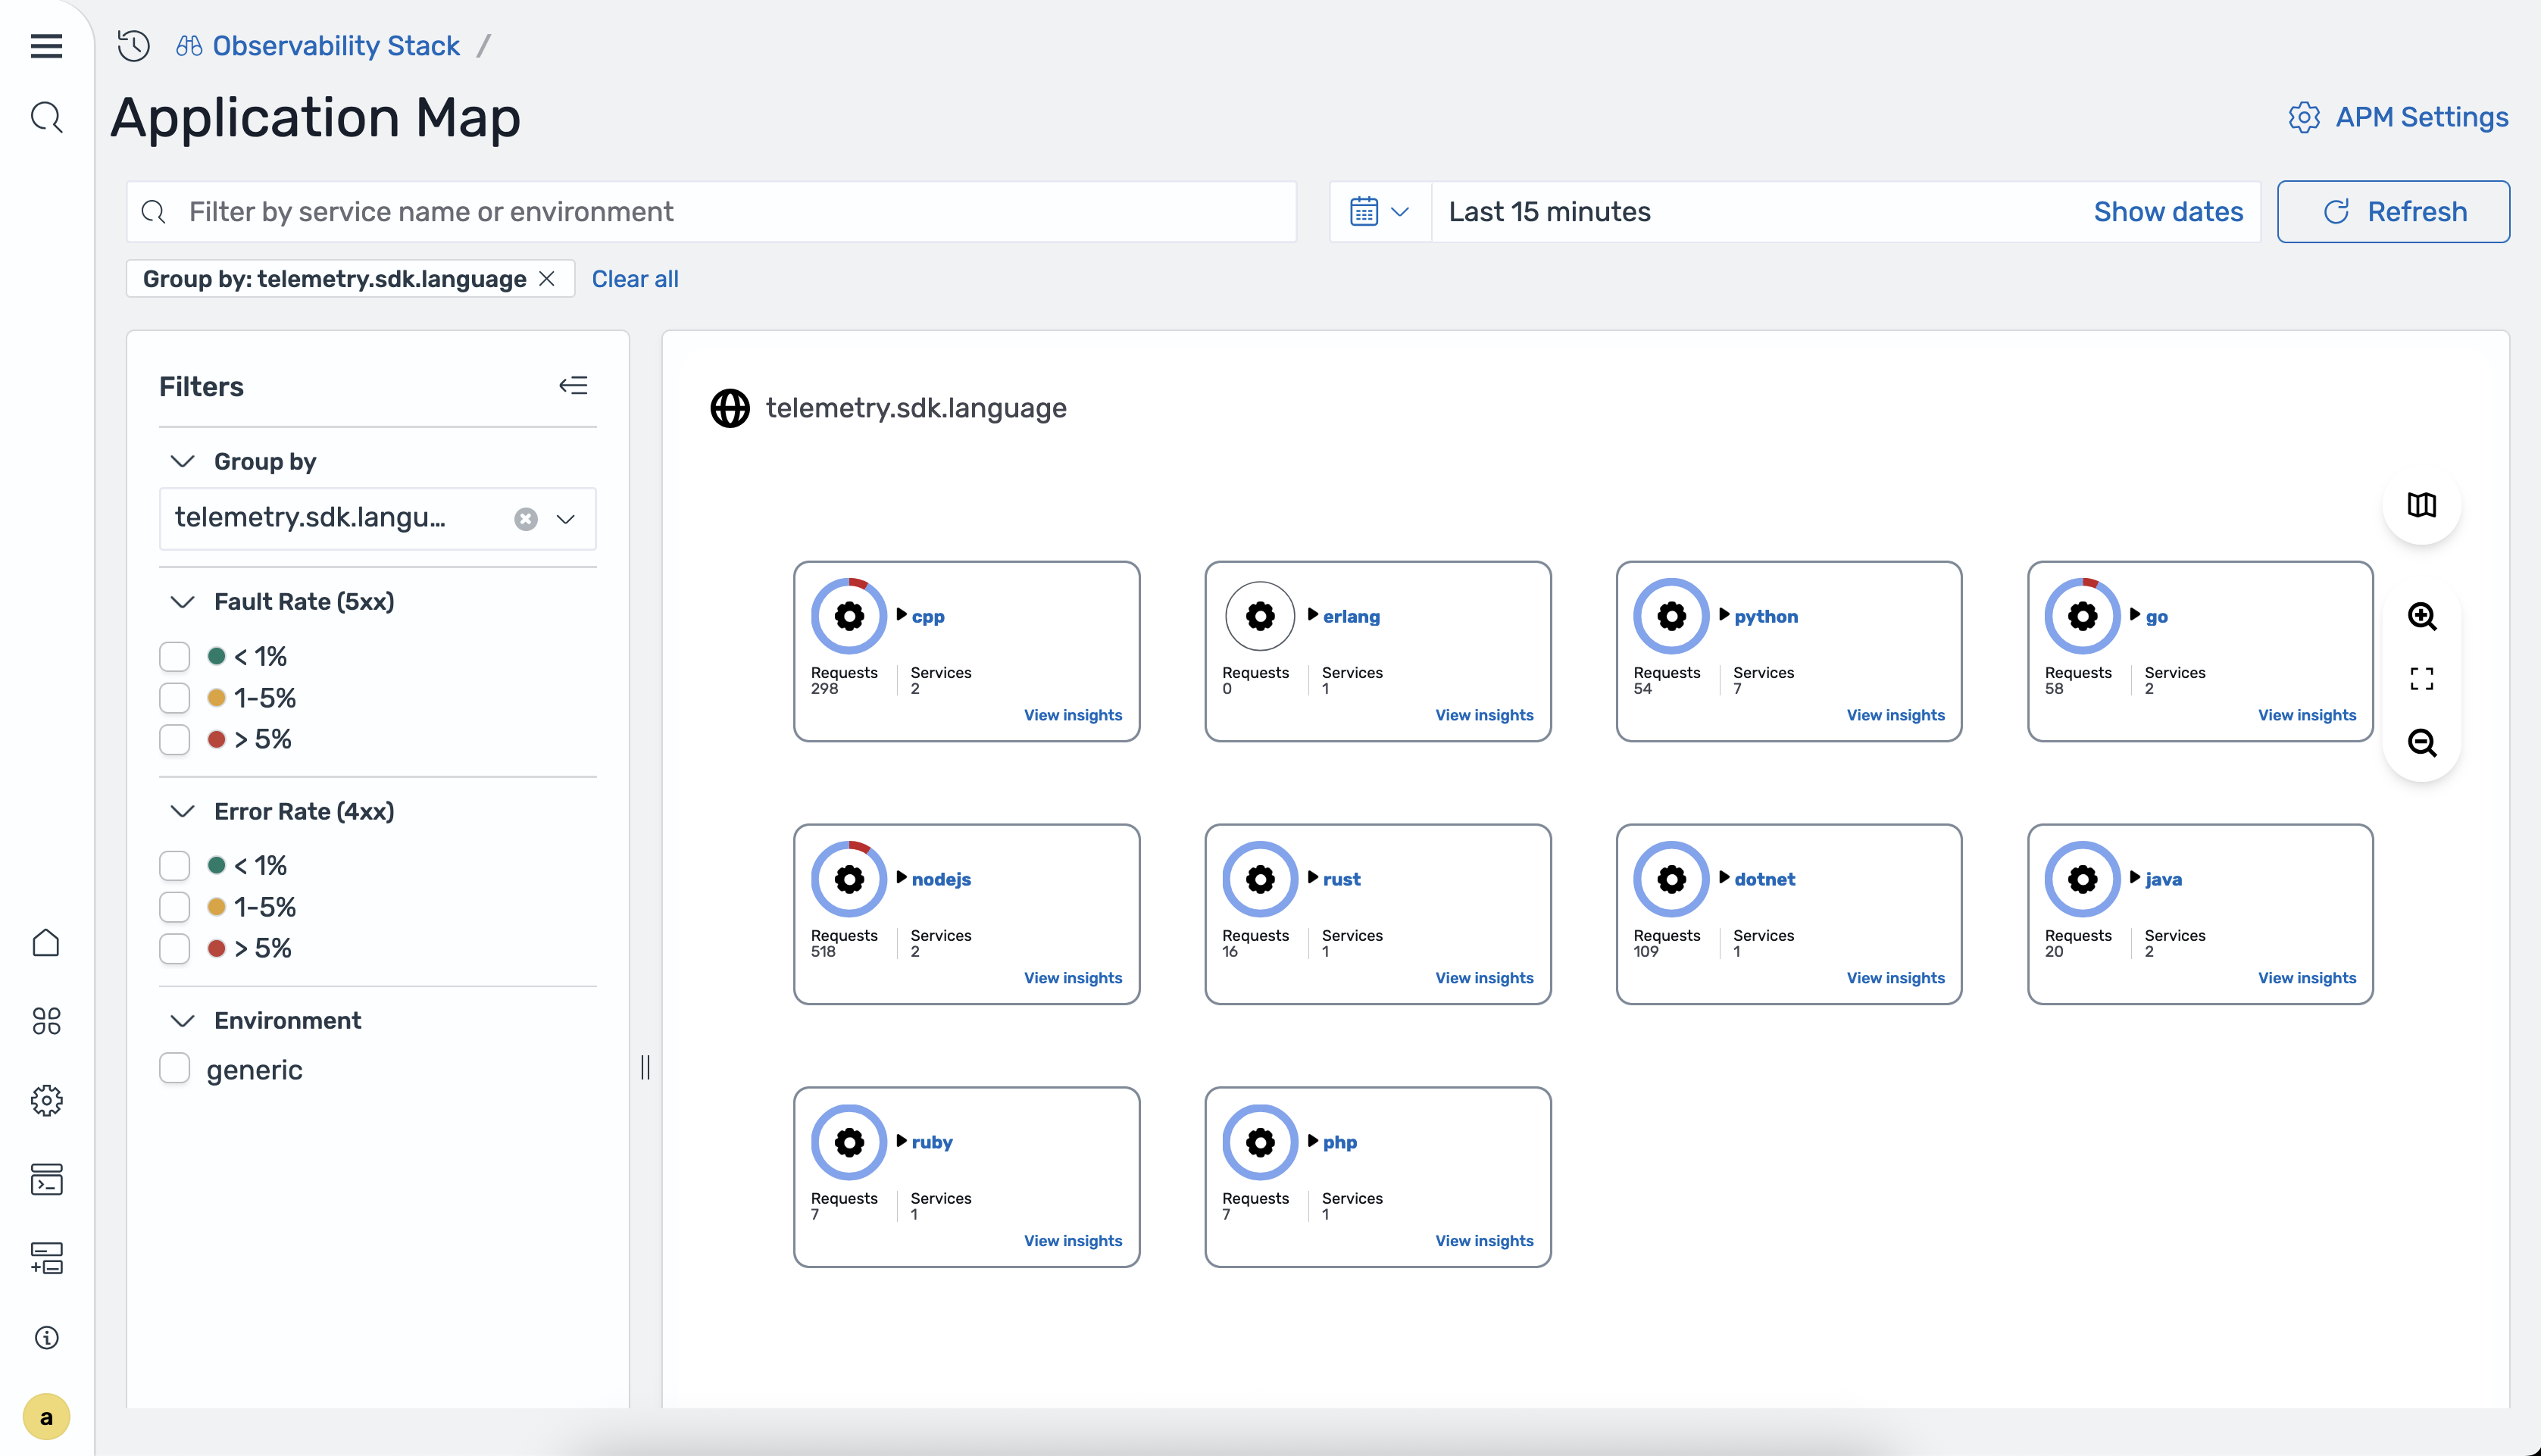
The available group-by attributes are determined by the
group_by_attributes setting in the
otel_apm_service_map processor configuration in
OpenSearch Ingestion.
Viewing node details
To view details for a service, select a node on the map. A detail panel opens with the following sections.
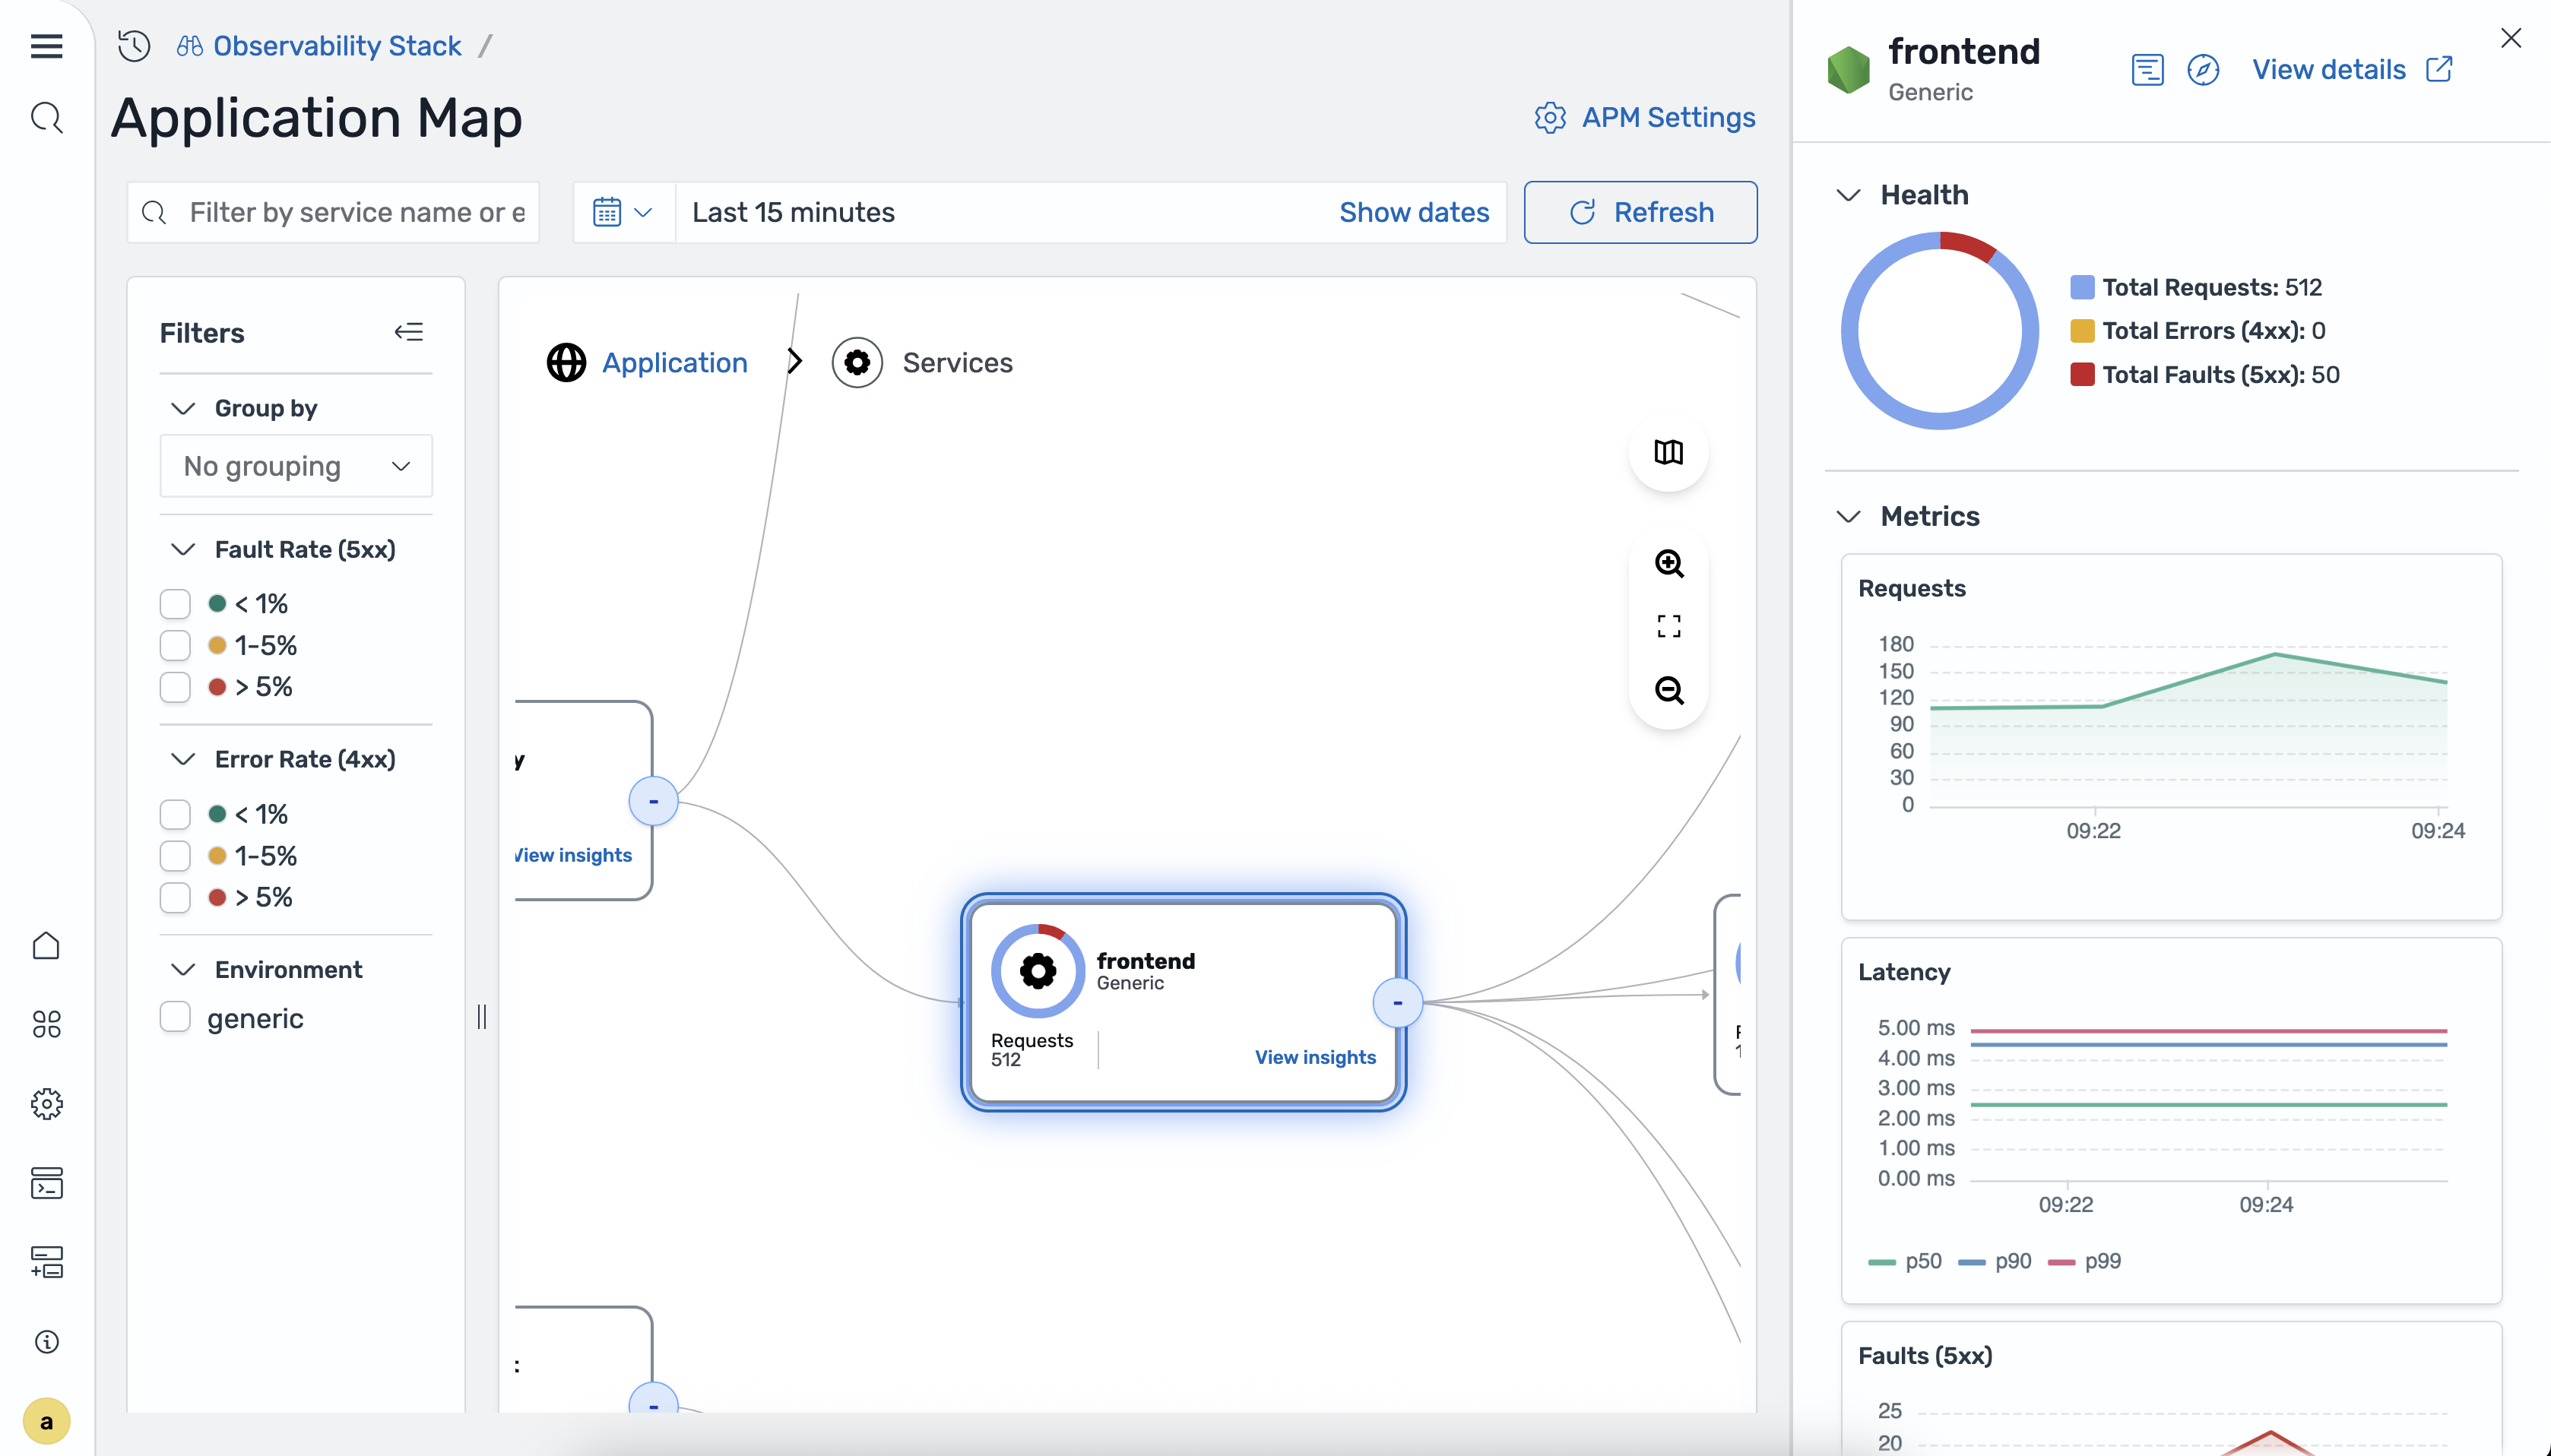
The Health section displays the following summary metrics:
-
Total Requests
-
Total Errors 4xx
-
Total Faults 5xx
The Metrics section displays the following time-series charts:
-
Requests
-
Latency P50/P90/P99
-
Faults 5xx
-
Errors 4xx
Choose View details to navigate to the Services detail view for the selected service.
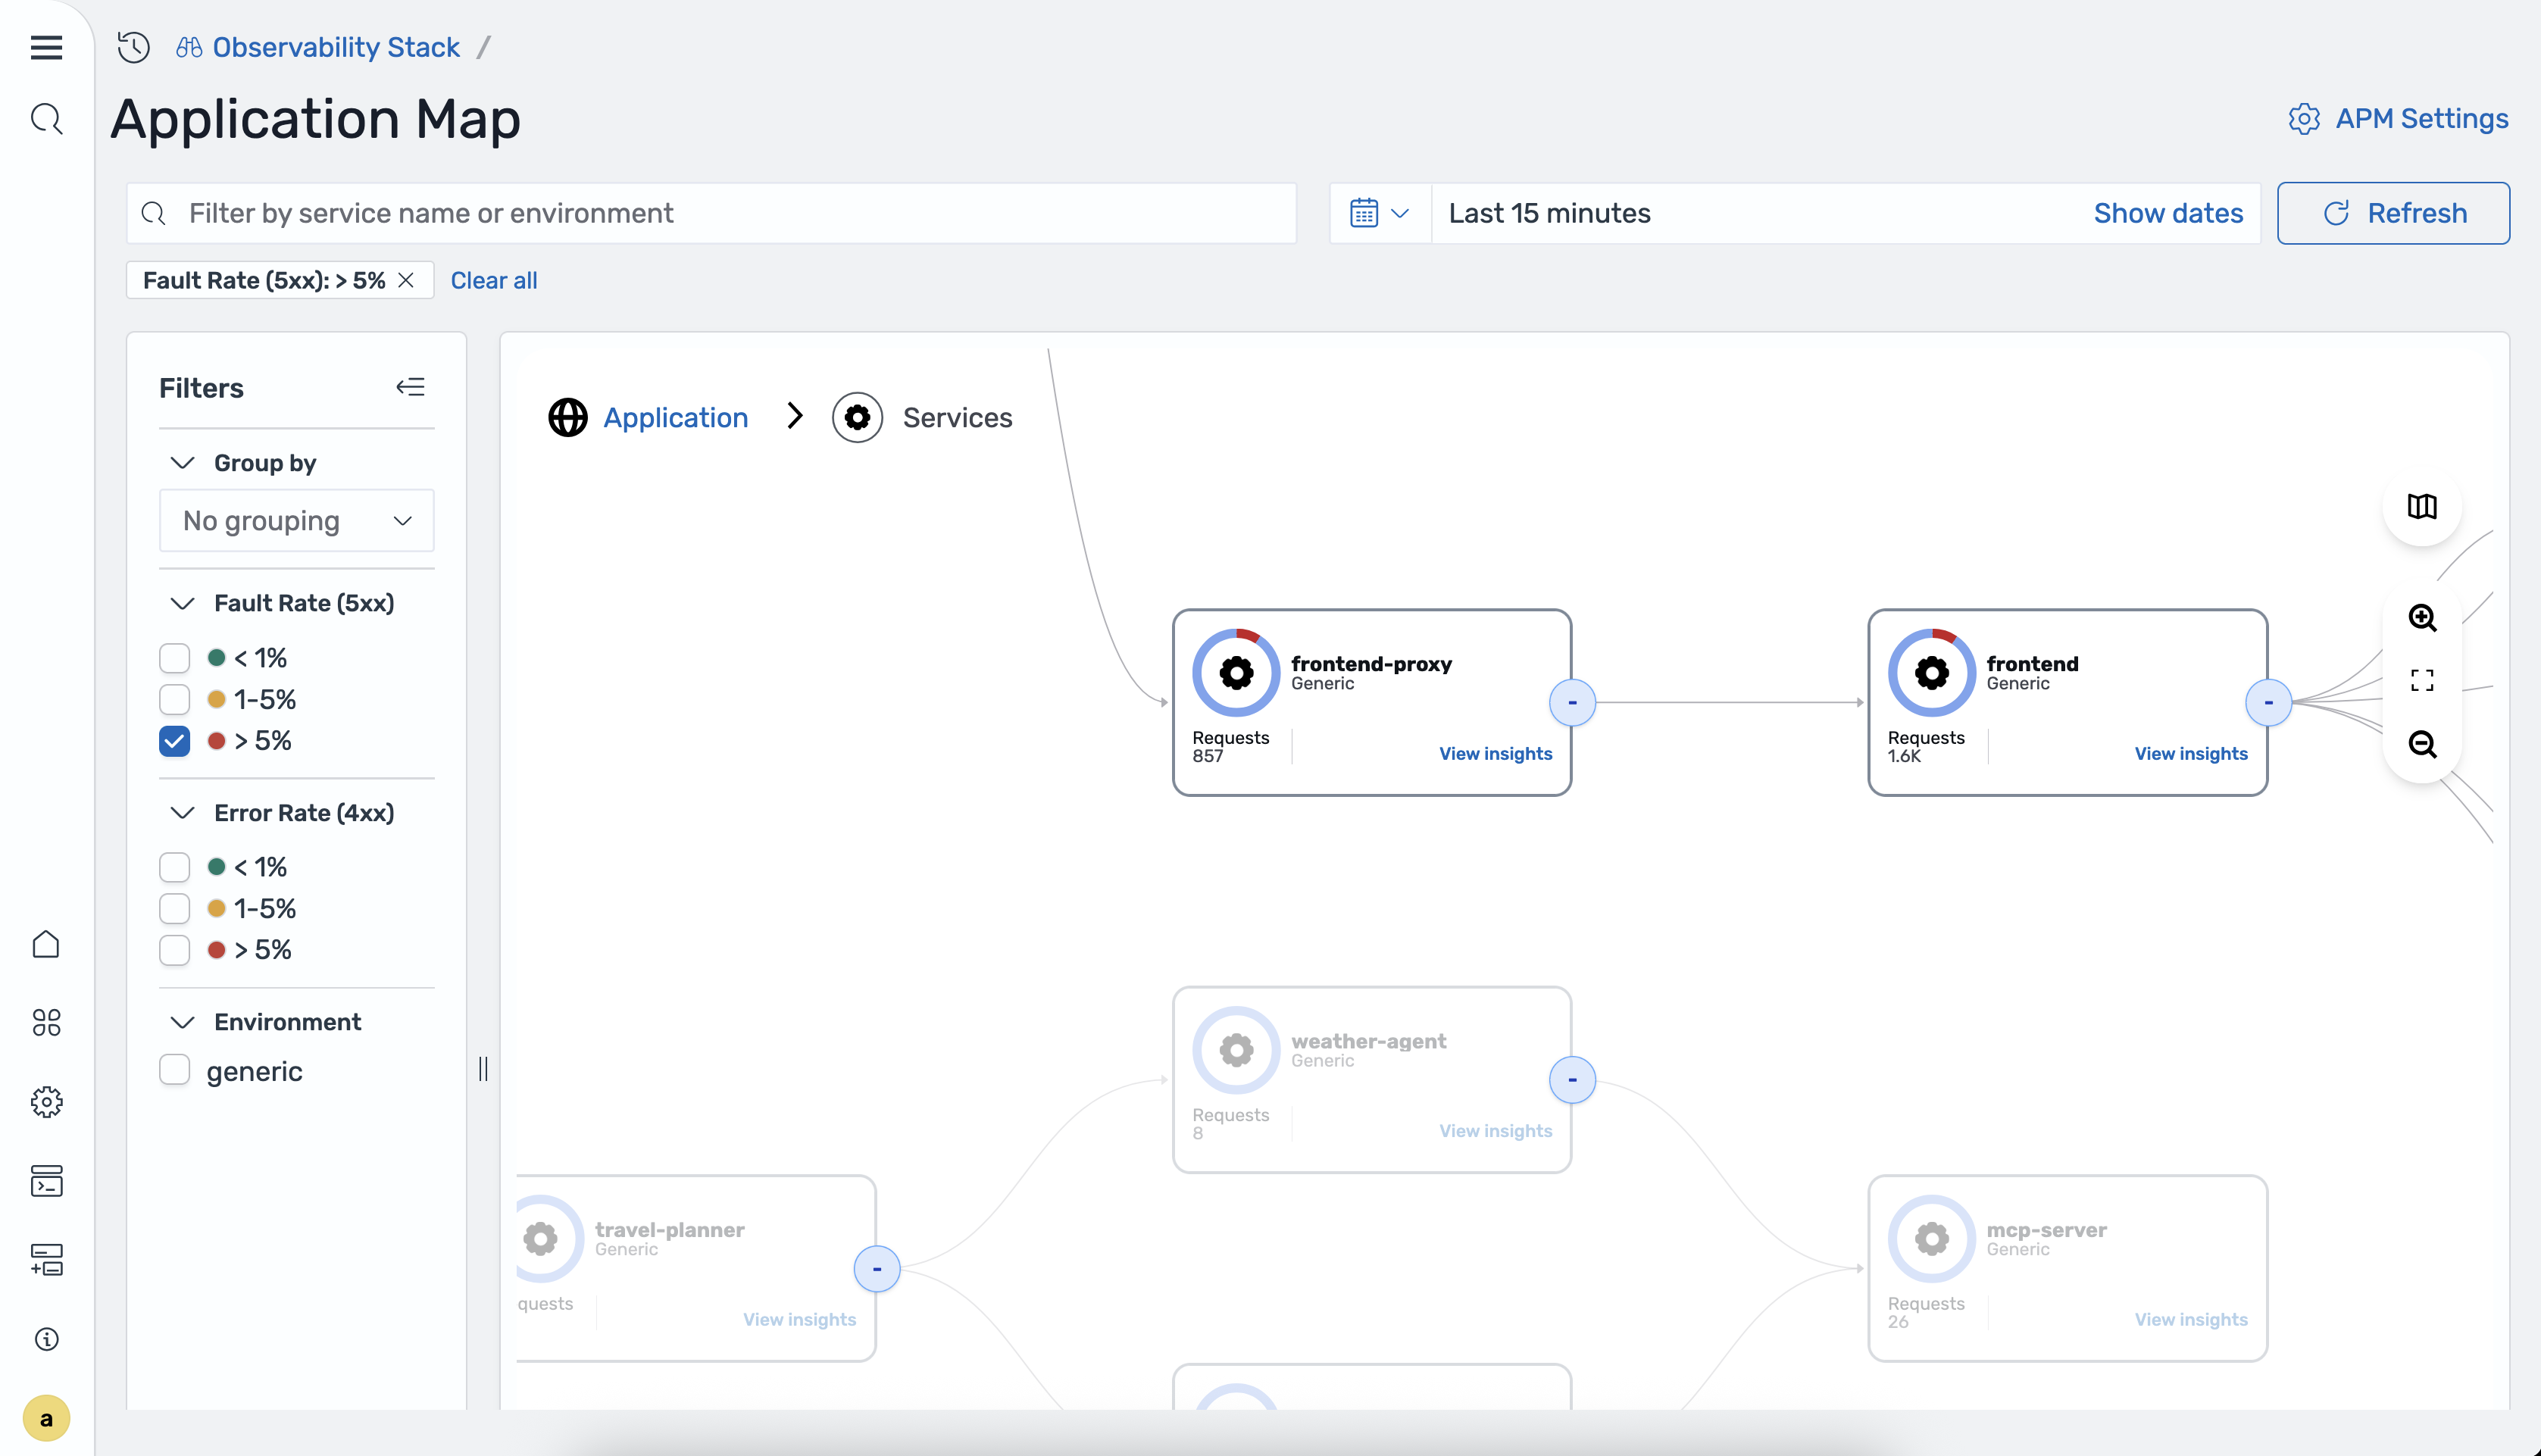
Filtering the map
You can filter the Application Map by using the following filters:
-
Fault rate – Filter services by server-side fault rate (5xx).
-
Error rate – Filter services by client-side error rate (4xx).
-
Environment – Filter services by deployment environment.
The following image shows the map filtered by error rate.
In-context correlations
You can navigate from the topology view directly to related traces and logs. From any service node, the following correlation options are available:
-
View related traces – Opens a filtered trace view for the selected service.
-
View related logs – Opens a filtered log view for the selected service.
