Connect to your observability tool
To query detailed observability metrics from your existing observability tool instead of using the SageMaker AI Insights dashboard in Amazon CloudWatch, SageMaker AI publishes metrics to Amazon CloudWatch through a regional PromQL endpoint that is compatible with Prometheus-based tools, including Amazon Managed Grafana, self-hosted Grafana, and other PromQL-compatible platforms. You authenticate using AWS Signature Version 4 (SigV4). This section describes how to configure a Prometheus data source, import the pre-configured dashboard template, and write PromQL queries for your inference metrics.
PromQL endpoint and authentication
| Setting | Value |
|---|---|
| Endpoint URL | https://monitoring. |
| Auth | Signature Version 4 (SigV4) |
| Service | monitoring |
| Required permissions | cloudwatch:QueryMetrics,
cloudwatch:GetMetricData,
cloudwatch:ListMetrics |
Setting up a Prometheus data source in Grafana
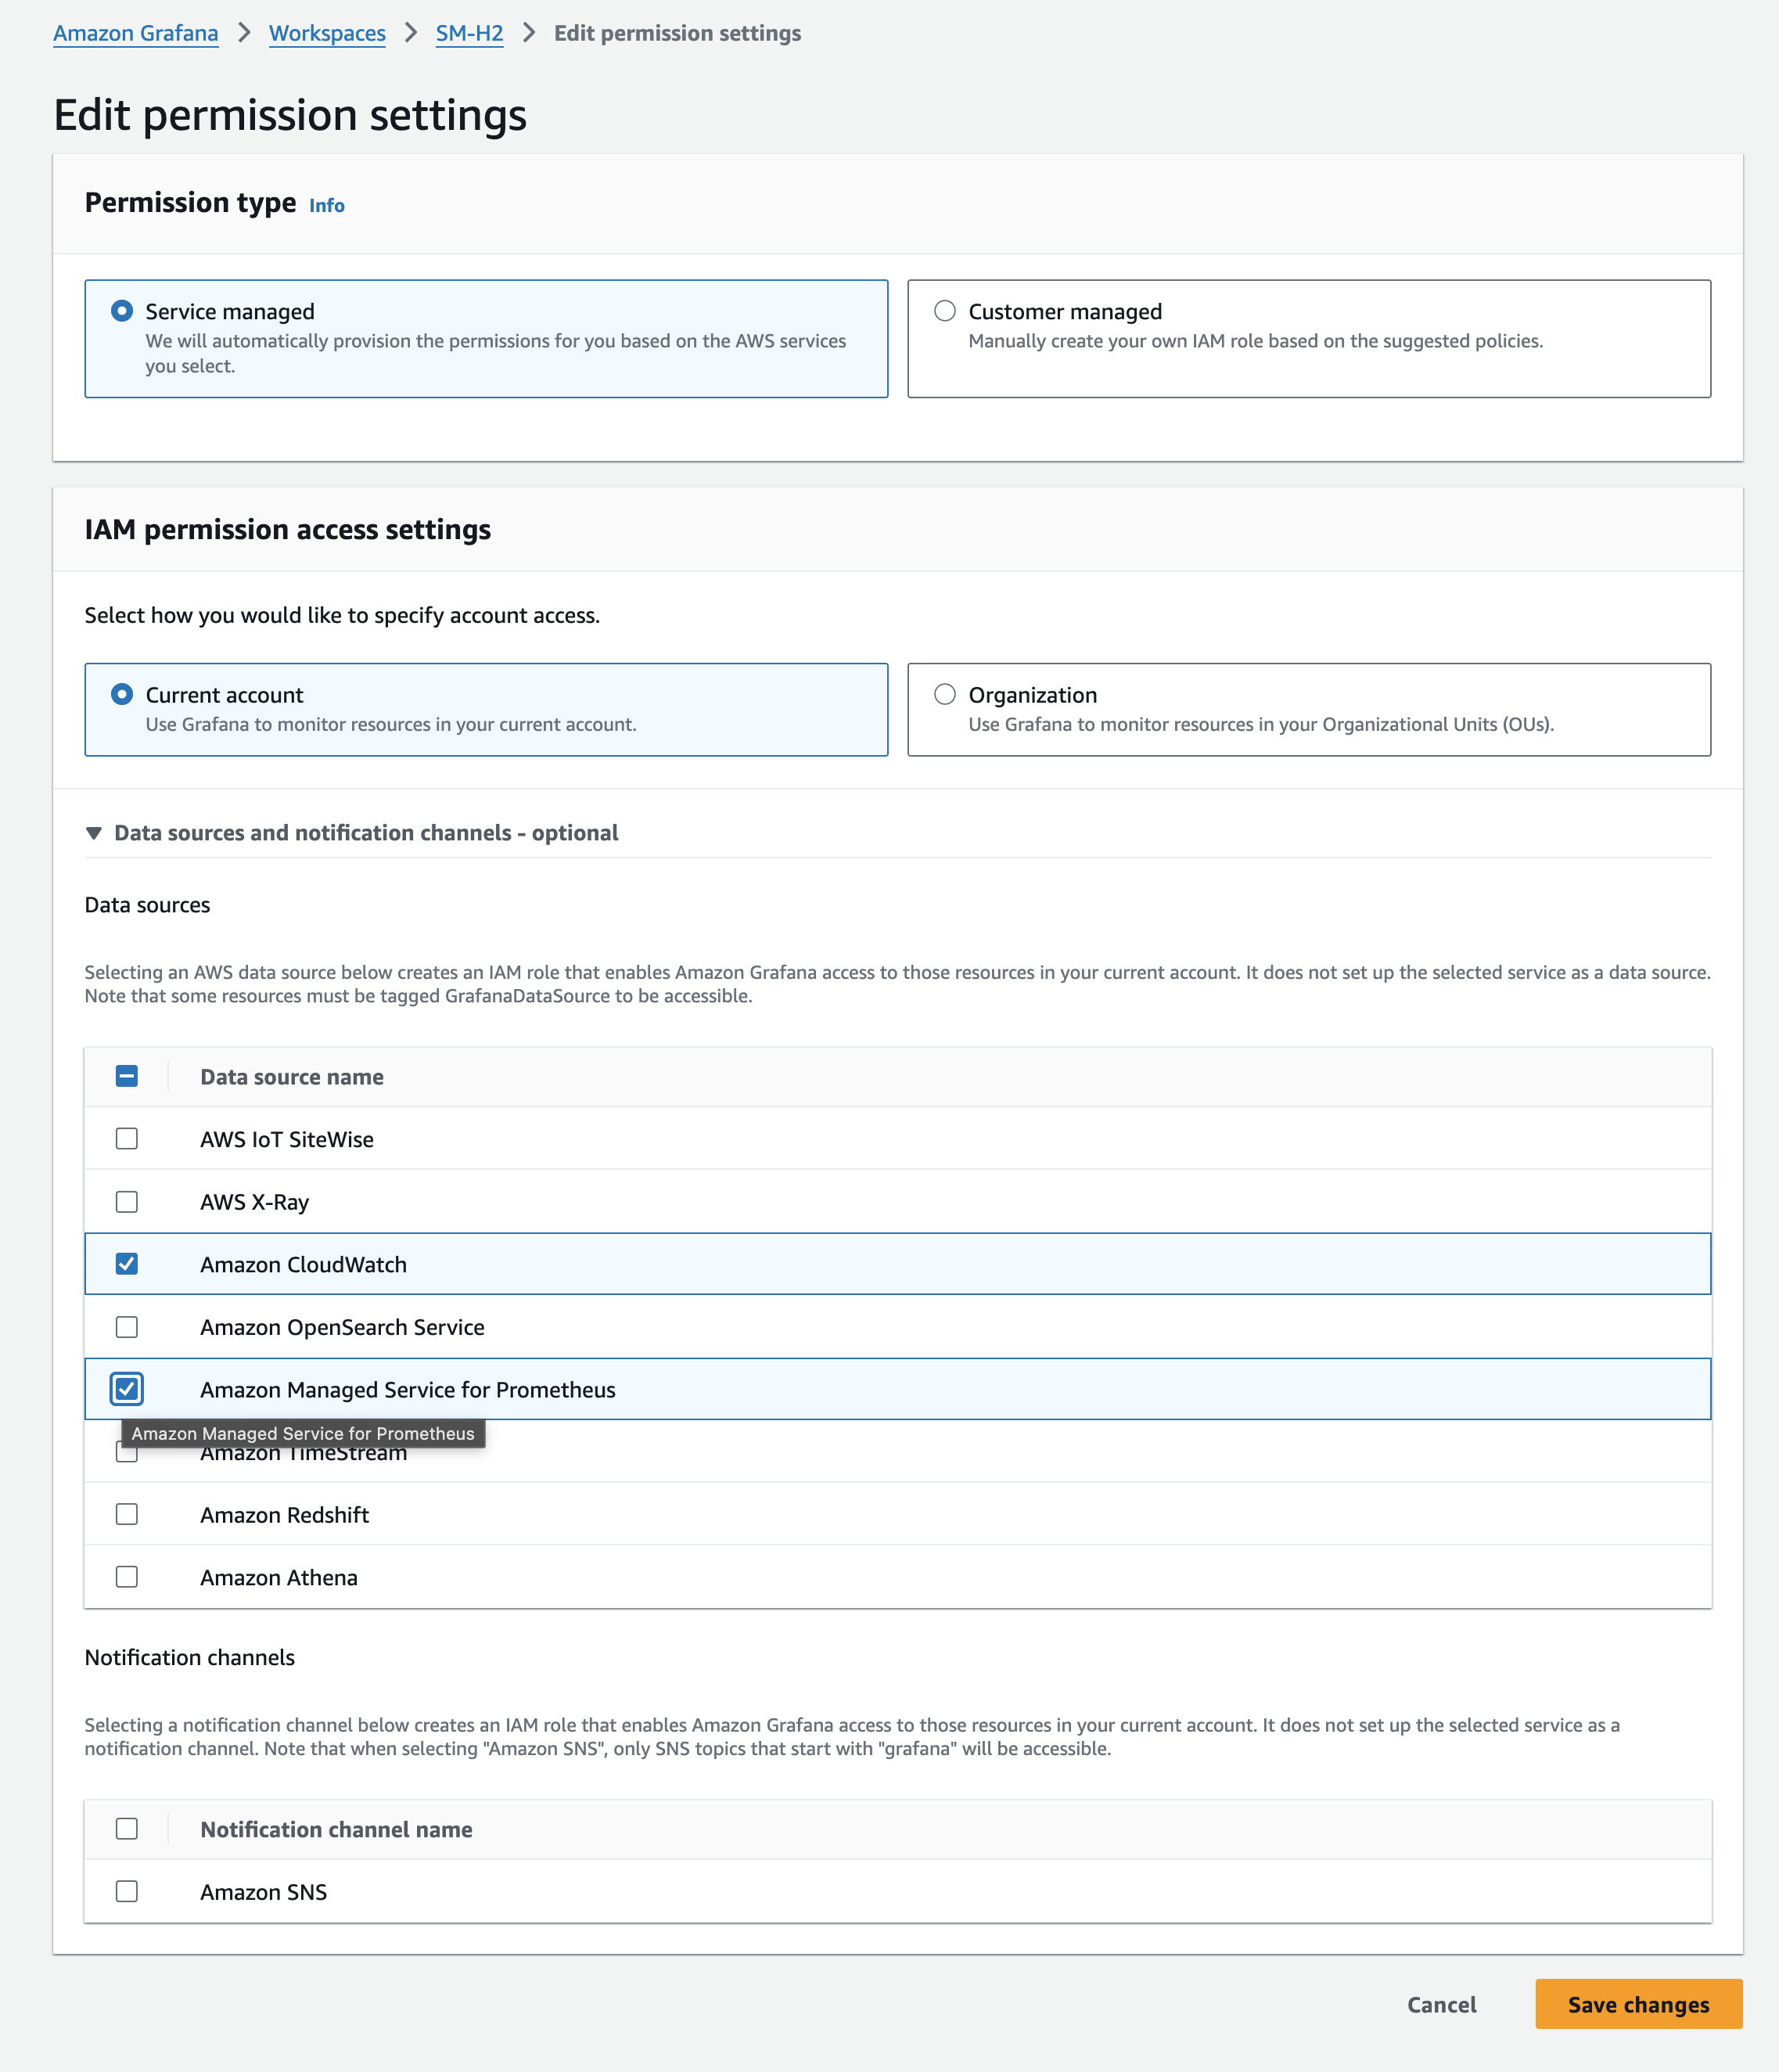
Option 1: Amazon Managed Prometheus (recommended for AMG)
-
Open AMG workspace → Data Sources → Add → Amazon Managed Service for Prometheus
-
Name:
SageMaker Inference (PromQL)region -
URL:
https://monitoring.region.amazonaws.com -
Default Region:
region -
Service:
monitoring -
Click Save and test
Option 2: Standard Prometheus data source
{
    "name": "SageMaker Inference (PromQL)",
    "type": "prometheus",
    "url": "https://monitoring.region.amazonaws.com",
    "access": "proxy",
    "jsonData": {
        "sigV4Auth": true,
        "sigV4AuthType": "default",
        "sigV4Region": "region",
        "sigV4Service": "monitoring",
        "httpMethod": "POST"
    }
}
IAM policy
{
    "Version": "2012-10-17",
    "Statement": [{
        "Effect": "Allow",
        "Action": [
            "cloudwatch:QueryMetrics",
            "cloudwatch:DescribeMetrics",
            "cloudwatch:GetMetricData",
            "cloudwatch:ListMetrics"
        ],
        "Resource": "*"
    }]
}
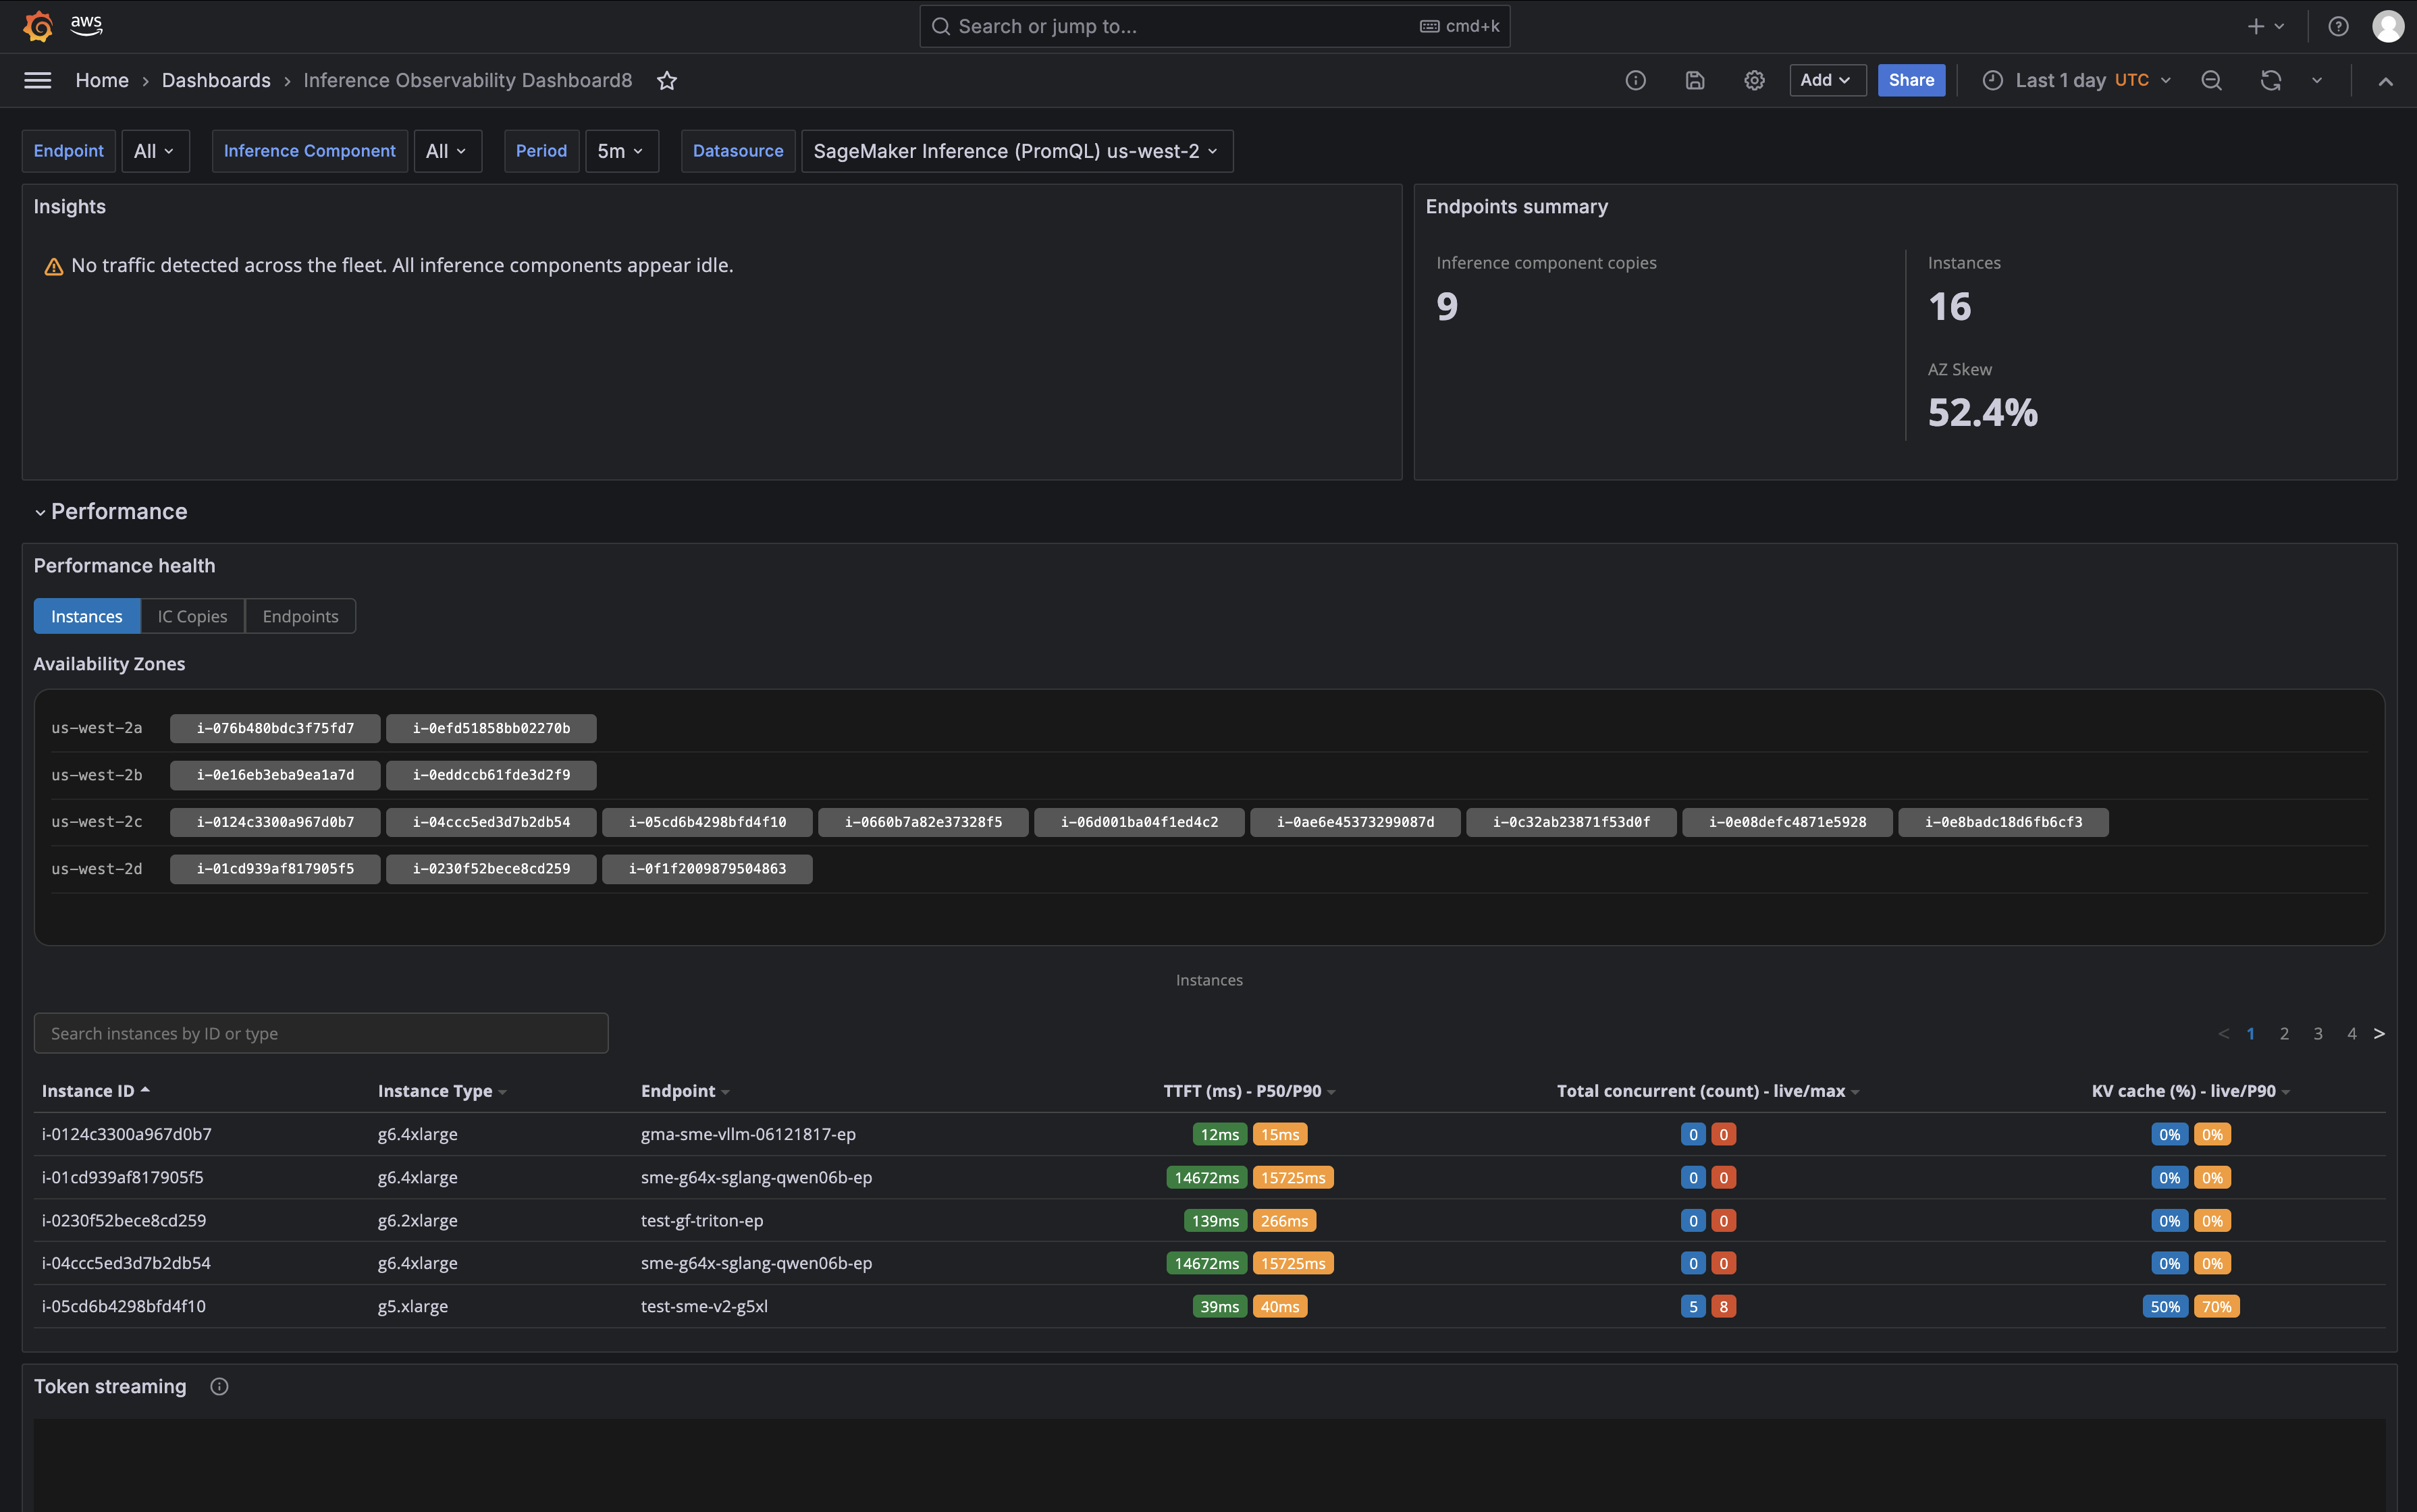
Importing the dashboard template
-
SageMaker AI Console → Endpoints → "Connect to your observability tool" → Dashboard template tab
-
Click Download Grafana Template (JSON)
-
In Grafana: Dashboards → Import → Upload JSON
-
Select your data source → Import
The template has 3 sections (Performance, Capacity, Reliability) matching the SageMaker AI Insights dashboard.
OTel labels available in PromQL
In PromQL, labels with dots must be enclosed in single quotes:
| Label | Description |
|---|---|
'aws.sagemaker.endpoint.name' |
Endpoint name |
'aws.sagemaker.inference_component.name' |
IC name |
'aws.sagemaker.inference_framework' |
Framework (vllm, sglang) |
'aws.sagemaker.variant.name' |
Variant name |
@resource.host.id |
Instance ID |
@resource.cloud.availability_zone |
Availability zone |
@resource.host.type |
Instance type |
Example PromQL queries
# GPU utilization per IC
avg by ('aws.sagemaker.inference_component.name') (
    DCGM_FI_DEV_GPU_UTIL{'aws.sagemaker.endpoint.name'="$endpoint"})

# Token throughput (total TPS)
sum(rate(vllm_prompt_tokens_total{'aws.sagemaker.endpoint.name'="$endpoint"}[5m]))
    + sum(rate(vllm_generation_tokens_total{'aws.sagemaker.endpoint.name'="$endpoint"}[5m]))

# TTFT P99
histogram_quantile(0.99, sum by (le) (
    rate(vllm_time_to_first_token_seconds_bucket{'aws.sagemaker.endpoint.name'="$endpoint"}[5m])))

# KV cache utilization
avg(vllm_kv_cache_usage_perc{'aws.sagemaker.endpoint.name'="$endpoint"})

# Queue depth per IC
sum by ('aws.sagemaker.inference_component.name') (
    vllm_num_requests_waiting{'aws.sagemaker.endpoint.name'="$endpoint"})

# CPU utilization (computed)
100 * (1 - avg by ('aws.sagemaker.endpoint.name') (
    rate(node_cpu_seconds_total{mode="idle",'aws.sagemaker.endpoint.name'="$endpoint"}[5m])))

# Error rate (5XX)
sum(rate(Response_5XX_total{'aws.sagemaker.endpoint.name'="$endpoint"}[5m]))
