Aidez à améliorer cette page
Les traductions sont fournies par des outils de traduction automatique. En cas de conflit entre le contenu d'une traduction et celui de la version originale en anglais, la version anglaise prévaudra.
Pour contribuer à ce guide de l'utilisateur, cliquez sur le GitHub lien Modifier cette page sur qui se trouve dans le volet droit de chaque page.
Les traductions sont fournies par des outils de traduction automatique. En cas de conflit entre le contenu d'une traduction et celui de la version originale en anglais, la version anglaise prévaudra.
Configuration du cluster Amazon EKS pour les AI/ML charges de travail à l'aide de CLI
Astuce
Inscrivez-vous
Cette section explique les étapes à suivre pour créer l'infrastructure requise pour exécuter des charges de travail de formation ou d'inférence sur Amazon EKS via des commandes CLI. Les étapes incluent la création d'un cluster EKS, de GPU-enabled nœuds avec EKS Auto Mode ou Karpenter, d'une pile de surveillance avec Prometheus et Grafana et d'un stockage Amazon S3 pour le poids des modèles.
Consultez la documentation d'EKS Auto Mode et de Karpenter
High-level architecture et flux de travail
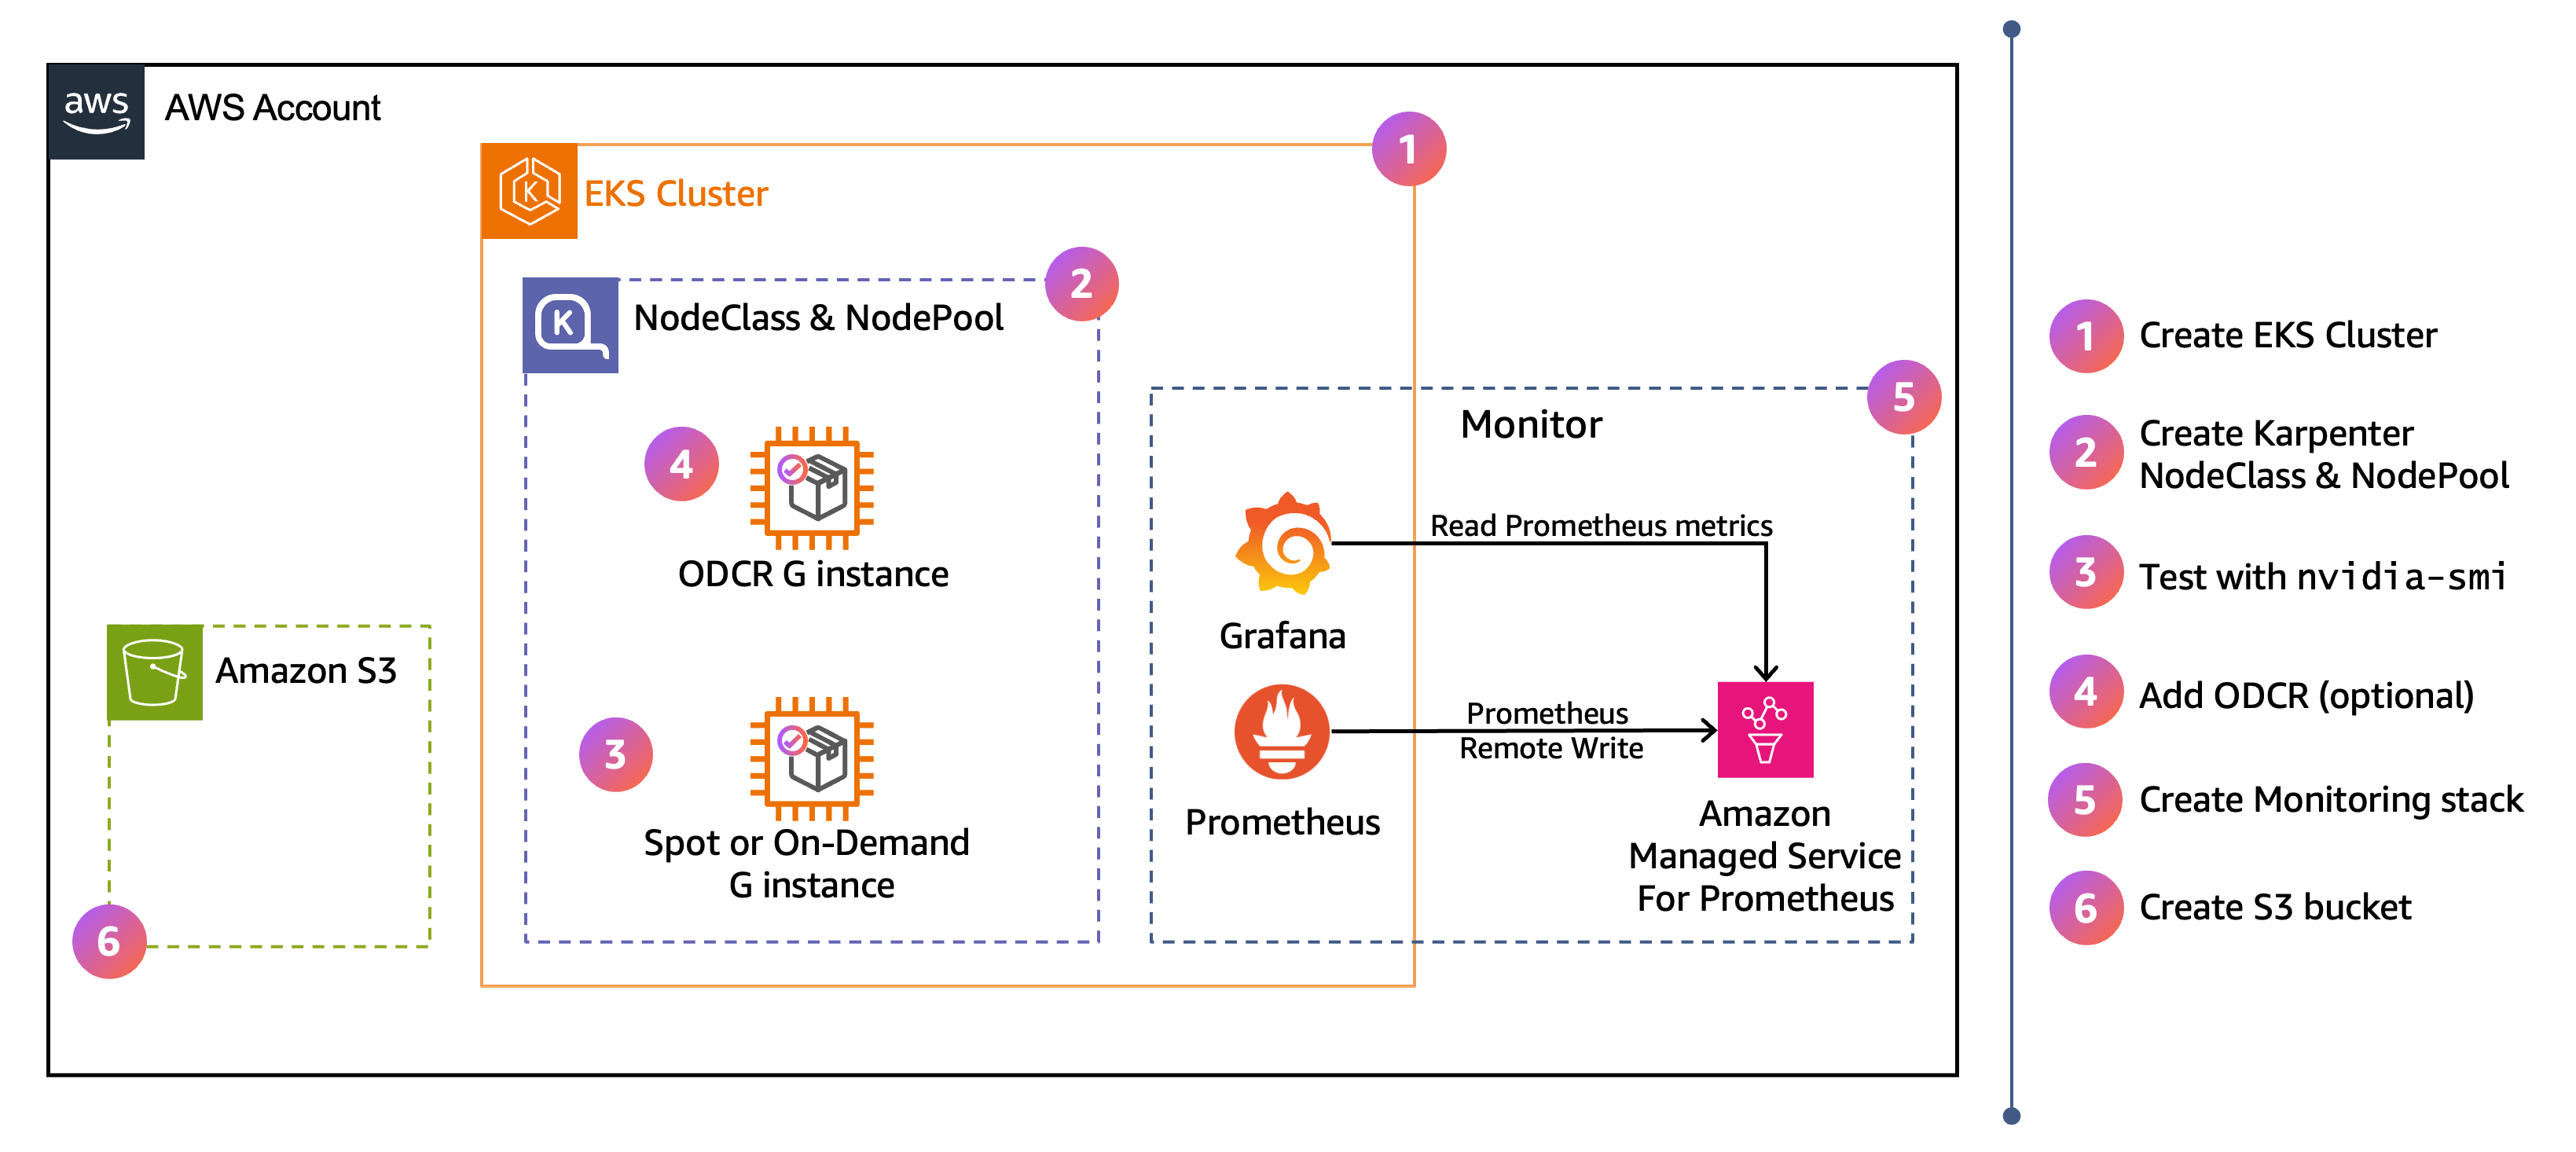
Le schéma montre l'architecture AWS de haut niveau pour la configuration de cette section. Les étapes numérotées sur la droite indiquent l'ordre dans lequel vous avez effectué la configuration dans les étapes ci-dessous.
Conditions préalables
-
kubectl>= 1,35. Pour les instructions de configuration, voirConfigurer kubectl et eksctl. -
AWS CLI >= 2,27. Pour les instructions de configuration, reportez-vous à la section Installation.
-
Casque >= 3.14. Pour les instructions de configuration, voir Setup Helm.
-
jq. Pour les instructions de configuration, voir Download jq. -
eksctl>= 0,227,0. Pour les instructions de configuration, consultez la section Installationdans la eksctldocumentation.
Vérifiez votre eksctl version :
eksctl version
Si vous utilisez une version antérieure à 0.227.0, suivez le guide d'installation d'eksctl pour
Définir les variables d'environnement
Veillez à ce que le nom du cluster et AWS la région suivants soient cohérents tout au long de ces étapes. Si vous le modifiez, les commandes suivantes risquent de cibler le mauvais cluster EKS.
export CLUSTER_NAME=ai-eks-docs
export AWS_REGION=us-east-2
L'utilisation de tous les AZs disponibles améliore la tolérance aux pannes et augmente les chances d'obtenir la capacité du GPU :
export AZS=$(aws ec2 describe-availability-zones \
  --region ${AWS_REGION} \
  --query "AvailabilityZones[?ZoneId!='use1-az3' && ZoneId!='usw1-az2' && ZoneId!='cac1-az3'].ZoneName" \
  --output text | tr '\t' ',')
echo $AZS
Important
Les zones de disponibilité use1-az3usw1-az2, et cac1-az3 sont exclues car Amazon EKS ne prend pas en charge le placement de plans de contrôle dans ces zonesUnsupportedAvailabilityZoneException.
Sortie attendue :
us-east-2a,us-east-2b,us-east-2c
Les AZ de la sortie varient selon les régions. Cet exemple montre les AZ disponibles pour us-east-2 la région.
Création d'un cluster et d'un GPU NodePool
Cette section fournit deux chemins pour créer votre cluster et vos GPU-enabled nœuds EKS, illustrés dans le schéma suivant. Choisissez une seule option dans le guide.
-
Mode automatique EKS — Outre les principaux modules complémentaires de mise en réseau, de stockage et d'équilibrage de charge, le mode automatique EKS inclut et gère les fonctionnalités suivantes pour les charges de travail d'entraînement et d'inférence : agent de surveillance des nœuds EKS, réparation automatique des nœuds, snapshotter SOCI
pour des extractions rapides de conteneurs et disponibilité du GPU pour le réglage par défaut. NodeClass Le plug-in de périphérique NVIDIA est inclus dans l'AMI accélérée Bottlerocket qu'EKS Auto Mode utilise pour les nœuds. GPU-enabled -
Self-managed Karpenter — Sur un cluster EKS sans mode automatique EKS, vous êtes responsable de l'installation et de la configuration des composants nécessaires aux charges de travail de formation et d'inférence. Cela inclut les extensions réseau (VPC CNI, CoreDNS, kube-proxy), Karpenter, l'agent de surveillance des nœuds EKS, le plug-in de périphérique NVIDIA et le snapshotter SOCI pour des extractions rapides de conteneurs.
Options du cluster EKS : mode automatique EKS et Karpenter autogéré
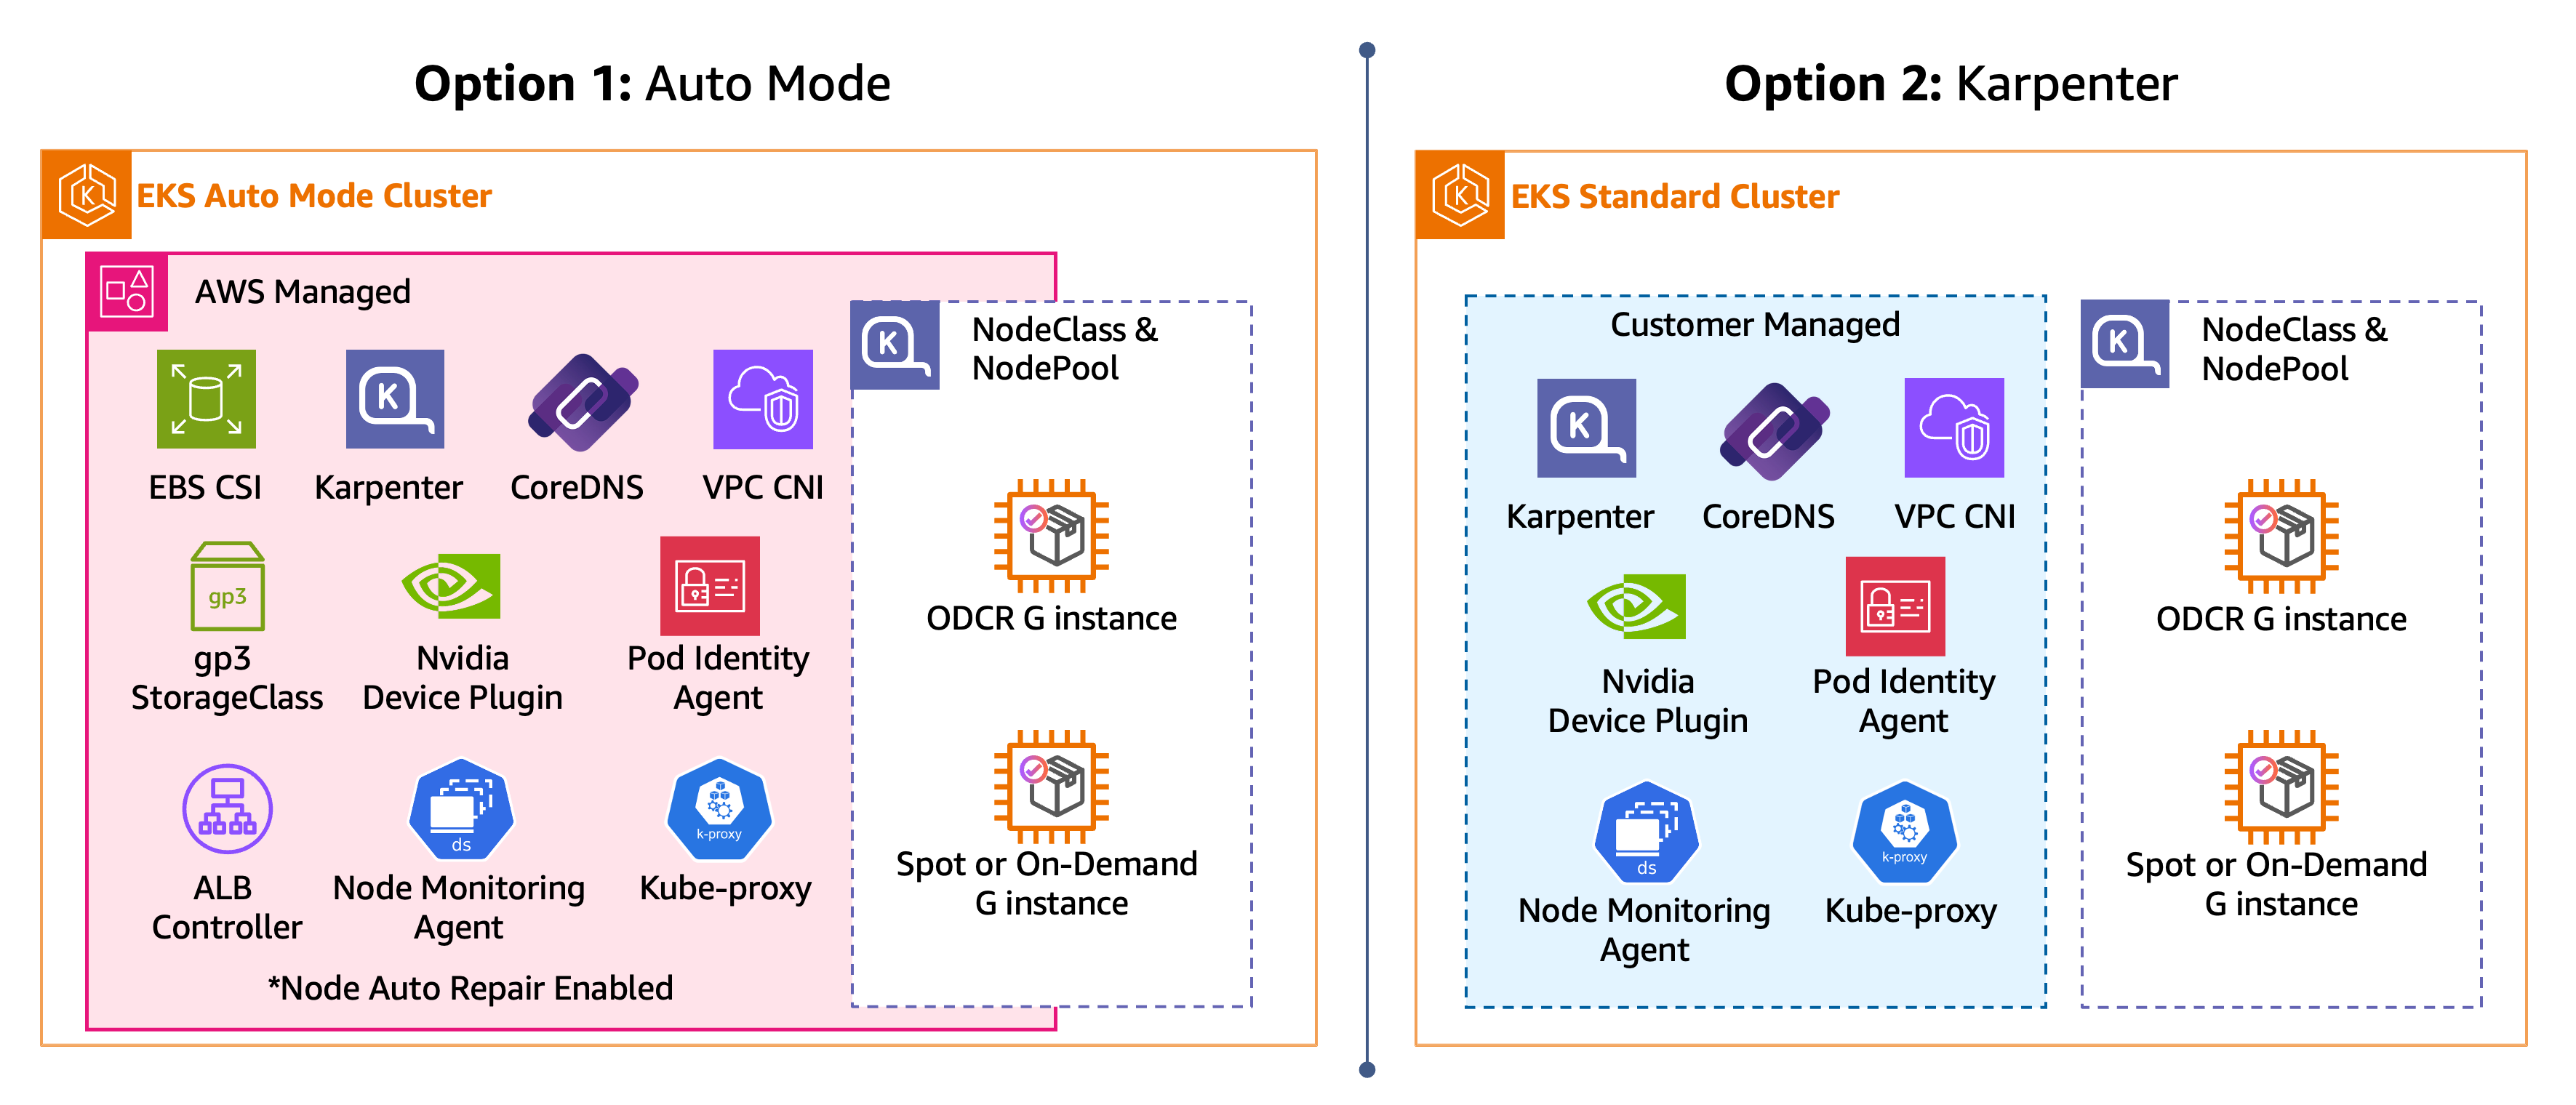
Dans chacune des étapes suivantes, choisissez un chemin (mode automatique EKS, Karpenter) et suivez-le tout au long. Après avoir effectué les étapes correspondant au chemin que vous avez choisi, vous disposerez d'un cluster EKS doté d'un GPU NodePool prêt à planifier les charges de travail du GPU.
Étape 1 : créer un cluster
Commencez par créer votre cluster EKS et installez les composants du cluster nécessaires aux charges de travail du GPU.
Avec le mode automatique EKS, une seule eksctl create cluster --enable-auto-mode commande approvisionne un cluster EKS prêt à supporter les charges de travail du GPU.
Avec Karpenter autogéré, la eksctl create cluster commande fournit les modules complémentaires réseau principaux, puis des étapes supplémentaires sont nécessaires pour activer la réparation automatique des nœuds via une fonctionnalité Karpenter, installer l'agent de surveillance des nœuds EKS et installer le plug-in de périphérique NVIDIA.
Avertissement
Pour le mode automatique EKS et les chemins Karpenter autogérés, la réparation automatique des nœuds se comporte de la même manière que pour les nœuds approvisionnés par. NodePools La réparation automatique des nœuds en mode automatique EKS et Karpenter est une méthode de perturbation puissante qui contourne l'karpenter.sh/do-not-disruptannotation PodDisruptionBudgets et. terminationGracePeriod La réparation automatique des nœuds attend 10 minutes avant de remplacer un nœud dont la AcceleratedHardwareReady condition est définie sur False et 30 minutes pour les autres conditions de réparation.
Étape 2 : Création d'un GPU dynamique NodePool
Définissez un NodePool qui approvisionne dynamiquement les instances de G-family GPU avec une génération supérieure à 4, en utilisant la capacité Spot On-Demand comme solution de secours. Le mode automatique EKS et les chemins Karpenter utilisent tous deux la même NodePool API, la seule différence étant celle vers laquelle ils NodeClass pointent. En mode EKS Auto, le bundle sélectionne default NodeClass déjà l'AMI appropriée et configure le pull parallèle SOCI, de sorte que c'est NodePool le seul objet que vous créez. Dans Karpenter autogéré, vous avez également besoin d'une personnalisation EC2NodeClass qui épingle l'AMI et ajuste le SOCI.
Validez que le NodePool a été créé :
kubectl get nodepool gpu-inf
Sortie attendue :
NAME      NODECLASS   NODES   READY   AGE
gpu-inf   default     0       True    8s
Sur le chemin Karpenter autogéré, la colonne NODECLASS affiche au lieu de. gpu-inf default
Étape 3 : Test avec un module d'échantillonnage
Testez la NodePool configuration de votre GPU avec un nvidia-smi Pod.
cat << EOF | kubectl apply -f -
apiVersion: v1
kind: Pod
metadata:
  name: nvidia-smi
  labels:
    guide: ai-eks-docs
spec:
  tolerations:
    - key: "nvidia.com/gpu"
      operator: "Exists"
      effect: "NoSchedule"
  containers:
    - name: nvidia-smi
      image: public.ecr.aws/amazonlinux/amazonlinux:2023-minimal
      command: ["nvidia-smi"]
      resources:
        limits:
          nvidia.com/gpu: 1
  restartPolicy: OnFailure
EOF
Vérifiez que le Pod est planifié et terminé avec succès.
kubectl get pods
Sortie attendue :
NAME         READY   STATUS      RESTARTS   AGE
nvidia-smi   0/1     Completed   0          67s
Le STATUS : Terminé signifie que la commande nvidia-smi a été exécutée et s'est terminée. Consultez les journaux du Pod pour voir le GPU détecté par le nœud.
kubectl logs nvidia-smi
Sortie attendue :
+-----------------------------------------------------------------------------------------+
| NVIDIA-SMI 580.126.09             Driver Version: 580.126.09     CUDA Version: 13.0     |
+-----------------------------------------+------------------------+----------------------+
| GPU  Name                 Persistence-M | Bus-Id          Disp.A | Volatile Uncorr. ECC |
| Fan  Temp   Perf          Pwr:Usage/Cap |           Memory-Usage | GPU-Util  Compute M. |
|                                         |                        |               MIG M. |
|=========================================+========================+======================|
|   0  NVIDIA RTX PRO 6000 Blac...    On  |   00000000:2B:00.0 Off |                    0 |
| N/A   30C    P0             81W /  600W |       0MiB /  97887MiB |      0%      Default |
|                                         |                        |             Disabled |
+-----------------------------------------+------------------------+----------------------+
La sortie indique le modèle de GPU, la version du pilote, la version CUDA et la mémoire disponible. Dans cet exemple, Karpenter a provisionné une instance G7e dotée d'un GPU NVIDIA RTX PRO 6000 Blackwell avec 96 Go de mémoire. La température actuelle du GPU est de 30°C et P0 signifie que le GPU est dans son état de performance le plus élevé (inactif mais prêt). Le 81 W/600 W indique la consommation électrique actuelle par rapport à la capacité maximale, et 0 MiB/97887 MiB indique la mémoire GPU actuellement utilisée par rapport au total disponible. Comme le Pod vient d'exécuter nvidia-smi et de le quitter, aucune charge de travail n'utilise le GPU. La mémoire est donc à 0 et l'alimentation est inactive. La version du pilote GPU NVIDIA (580.126.09) provient de l'AMI Bottlerocket, tandis que la version CUDA (13.0) provient de l'image du conteneur. Le modèle de GPU et la mémoire varient en fonction du type d'instance sélectionné par Karpenter. Les instances G5 sont équipées de GPU NVIDIA A10G (24 Go), les instances G6e de GPU NVIDIA L40S (48 Go) et les instances G7e de GPU NVIDIA RTX PRO 6000 (96 Go).
Pour comprendre comment Karpenter et le planificateur Kubernetes se sont coordonnés pour approvisionner un nœud et placer le pod, vérifiez les événements du cycle de vie du pod :
kubectl describe po nvidia-smi
Sortie attendue :
Events:
  Type     Reason                  Age   From                   Message
  ----     ------                  ----  ----                   -------
  Warning  FailedScheduling        60s   default-scheduler      0/2 nodes are available: 2 node(s) had untolerated taint(s). no new claims to deallocate, preemption: 0/2 nodes are available: 2 Preemption is not helpful for scheduling.
  Normal   Nominated               59s   eks-auto-mode/compute  Pod should schedule on: nodeclaim/gpu-inf-vxcnj
  Normal   Scheduled               24s   default-scheduler      Successfully assigned default/nvidia-smi to i-0fb17a09bc4203164
  Warning  FailedCreatePodSandBox  21s   kubelet                Failed to create pod sandbox: rpc error: code = Unknown desc = failed to setup network for sandbox "7f85e25b220c8fb245187758dbbbc8efb3d40f3e49e13054404880daf4c3b2f0": plugin type="aws-cni" name="aws-cni" failed (add): add cmd: failed to setup network policy
  Normal   Pulling                  7s   kubelet                spec.containers{nvidia-smi}: Pulling image "public.ecr.aws/amazonlinux/amazonlinux:2023-minimal"
  Normal   Pulled                   5s   kubelet                spec.containers{nvidia-smi}: Successfully pulled image "public.ecr.aws/amazonlinux/amazonlinux:2023-minimal" in 1.237s (1.237s including waiting). Image size: 37442701 bytes.
  Normal   Created                  5s   kubelet                spec.containers{nvidia-smi}: Container created
  Normal   Started                  5s   kubelet                spec.containers{nvidia-smi}: Container started
Ces événements montrent la séquence de planification du Pod : le Pod échoue initialement car aucun nœud GPU n'existe (FailedScheduling), Karpenter désigne un nouveau NodeClaim (Nominé), le planificateur attribue le Pod une fois que le nœud est prêt (programmé), puis l'image du conteneur est extraite et démarrée. Le mode automatique EKS est livré avec un pull parallèle SOCI (Seekable OCI) installé et configuré immédiatement sur les instances G, P et Trn. Notez qu'en raison de l'extraction parallèle SOCI, l'image du conteneur a été extraite de l'ECR en moins de 2 secondes (1,237 s).
A NodeClaim est une demande créée par Karpenter pour approvisionner un nœud spécifique. Il indique le type d'instance, le type de capacité, l'AZ et indique si le nœud est prêt.
kubectl get nodeclaims
NodeClaim Résultat attendu :
NAME            TYPE          CAPACITY    ZONE         NODE                  READY   AGE
gpu-inf-xxxxx   g7e.2xlarge   spot        us-east-2a   i-0xxxxxxxxxxxx       True    2m
Le type d'instance et l'AZ peuvent varier. Toute G-family instance dont la génération est supérieure à 4 est éligible.
L'FailedCreatePodSandBoxavertissement entrant kubectl describe pod nvidia-smi est transitoire et attendu. Le VPC CNI s'initialise de manière asynchrone une fois le nœud rejoint, et le kubelet réessaie automatiquement. Si le Pod reste à l'ContainerCreatingintérieur, vérifiez les événements du nœud aveckubectl describe node <node-name>.
Astuce
Si aucun nœud n'apparaît, vérifiez les erreurs de capacité insuffisante :
kubectl get events | grep InsufficientCapacityError
Karpenter met en cache les offres non disponibles pendant 3 minutes. L'élargissement des types d'instances et des AZ autorisés NodePool augmente les chances d'obtenir une capacité d'atterrissage.
Note
Les instances Spot lancées par Karpenter n'apparaîtront pas dans la console EC2 Spot Requests. Karpenter utilise l'CreateFleetAPI EC2 avec. type: instant Les instances apparaissent dans la console EC2 Instances avec un spot cycle de vie.
Étape 4 : ajouter de la capacité réservée au NodePool (facultatif)
Pour utiliser d'abord la capacité réservée avec une solution de Spot/On-Demand secours, créez une réservation de On-Demand capacité (ODCR) et attachez-la à votre NodeClass, puis mettez à jour la dynamique NodePool de l'étape 2 pour autoriser reserved également la capacité. L'appel de l'API de réservation est le même pour les deux chemins ; la NodeClass pièce jointe est différente car EKS Auto Mode et Karpenter autogéré utilisent des types différents NodeClass .
Avertissement
La commande suivante entraîne des frais pour le type d'instance réservée jusqu'à ce que vous l'annuliez avecaws ec2 cancel-capacity-reservation --capacity-reservation-id <id>.
Créez la réservation de capacité :
CR_AZ="us-east-2a"
INSTANCE_TYPE="g6e.4xlarge"

aws ec2 create-capacity-reservation \
  --instance-type $INSTANCE_TYPE \
  --instance-platform Linux/UNIX \
  --availability-zone "$CR_AZ" \
  --instance-count 1 \
  --instance-match-criteria open \
  --end-date-type unlimited
Si un InsufficientInstanceCapacity message d'erreur s'affiche, passez CR_AZ à un autre AZ et réessayez.
Recherchez l'ID de réservation de capacité et stockez-le dans une variable shell pour les étapes suivantes :
CAPACITY_RESERVATION_ID=$(aws ec2 describe-capacity-reservations \
  --filters "Name=state,Values=active" "Name=instance-type,Values=${INSTANCE_TYPE}" \
  --query 'CapacityReservations[0].CapacityReservationId' \
  --output text \
  --region ${AWS_REGION})
echo "Capacity reservation ID: ${CAPACITY_RESERVATION_ID}"
Appliquez ensuite les NodePool modifications NodeClass et à votre chemin :
Karpenter considère reserved que c'est l'option la plus rentable et la lance en premier. Une fois la réservation complète, elle revient à Spot or On-Demand.
Après avoir appliqué les modifications, confirmez que Karpenter donne la priorité à la capacité réservée et revient à Spot ou. On-Demand Déployez un déploiement à 2 répliques qui nécessite 1 GPU par pod. L'ODCR est destiné à une instance, donc le premier Pod déclenche Karpenter pour lancer un nœud réservé. Le deuxième Pod ne peut pas tenir sur le nœud réservé et incite Karpenter à lancer un autre nœud à partir de Spot ou de On-Demand sa capacité.
cat << 'EOF' | kubectl apply -f -
apiVersion: apps/v1
kind: Deployment
metadata:
  name: gpu-overflow-test
  labels:
    guide: ai-eks-docs
spec:
  replicas: 2
  selector:
    matchLabels:
      app: gpu-overflow-test
  template:
    metadata:
      labels:
        app: gpu-overflow-test
        guide: ai-eks-docs
    spec:
      tolerations:
        - key: nvidia.com/gpu
          operator: Exists
          effect: NoSchedule
      containers:
        - name: nvidia-smi
          image: public.ecr.aws/amazonlinux/amazonlinux:2023-minimal
          command: ["sh", "-c", "nvidia-smi && sleep infinity"]
          resources:
            limits:
              nvidia.com/gpu: 1
EOF
Contrairement au pod de nvidia-smi test de l'étape 3 qui s'exécutait et s'arrêtait, ce déploiement permet aux pods de fonctionner (sleep infinity) afin qu'ils contiennent le GPU et ne libèrent pas le nœud.
Vérifiez les pods planifiés sur les différents nœuds :
kubectl get pods -l app=gpu-overflow-test -o wide
Sortie attendue :
NAME                                 READY   STATUS    RESTARTS   AGE     IP                NODE                  NOMINATED NODE   READINESS GATES
gpu-overflow-test-59b97944fb-lq56c   1/1     Running   0          2m42s   192.168.186.240   i-057692590480155da   <none>           <none>
gpu-overflow-test-59b97944fb-z4zcx   1/1     Running   0          2m42s   192.168.130.64    i-0521ecd1849fa0578   <none>           <none>
Les deux pods fonctionnent, chacun sur un nœud différent.
Consultez le NodeClaims pour connaître les types de capacité :
kubectl get nodeclaims
Sortie attendue :
NAME            TYPE          CAPACITY    ZONE         NODE                  READY   AGE
gpu-inf-shg5w   g6e.xlarge    reserved    us-east-2a   i-0ea91fdeef65b8cb6   True    2m2s
gpu-inf-ssnqf   g7e.2xlarge   spot        us-east-2b   i-00ccf7ce65cf3f6ca   True    112s
Le nœud réservé a été lancé en premier, suivi d'un Spot ou d'un On-Demand nœud une fois la réservation complète.
Nettoyez le déploiement des tests :
kubectl delete deployment gpu-overflow-test
Contrôle
Installez une pile de surveillance qui collecte les métriques des clusters, des nœuds et du GPU dans Amazon Managed Service for Prometheus (AMP), et visualisez-les avec Grafana. Le graphique Helm kube-prometheus-stack déploie Prometheus pour extraire et écrire à distance des métriques dans AMP, ainsi qu'un Grafana autogéré pour les tableaux de bord. L'exportateur NVIDIA DCGM ajoute GPU-specific des métriques (utilisation, mémoire, température, puissance, NVLink, activité tensorielle).
Prometheus, Grafana et l'opérateur atterrissent par défaut sur des nœuds autres que le GPU, car les nœuds GPU sont porteurs de cette odeur. nvidia.com/gpu:NoSchedule Node-exporter et l'exportateur DCGM fonctionnent tous deux sur des nœuds GPU, ce qui nous permet de récupérer les métriques de l'hôte et du GPU à l'échelle du parc.
Si vous avez ouvert un nouveau terminal, définissez le nom et la région du cluster :
export CLUSTER_NAME=ai-eks-docs
export AWS_REGION=us-east-2
Création de l'espace de travail AMP
Créez un espace de travail AMP pour stocker les métriques :
aws amp create-workspace \
  --alias "amp-ws-${CLUSTER_NAME}" \
  --region ${AWS_REGION}
Obtenez l'identifiant de l'espace de travail :
AMP_WORKSPACE_ID=$(aws amp list-workspaces \
  --alias "amp-ws-${CLUSTER_NAME}" \
  --query 'workspaces[0].workspaceId' \
  --output text \
  --region ${AWS_REGION})

echo "AMP Workspace ID: ${AMP_WORKSPACE_ID}"
Obtenez le point de terminaison d'écriture à distance :
AMP_ENDPOINT=$(aws amp describe-workspace \
  --workspace-id ${AMP_WORKSPACE_ID} \
  --query 'workspace.prometheusEndpoint' \
  --output text \
  --region ${AWS_REGION})

echo "AMP Endpoint: ${AMP_ENDPOINT}"
Création d'une politique IAM et d'associations d'identité EKS Pod
Créez une politique IAM qui permet à Prometheus d'écrire à distance des métriques et à Grafana de les interroger :
ACCOUNT_ID=$(aws sts get-caller-identity --query Account --output text)

AMP_POLICY_ARN=$(aws iam create-policy \
  --policy-name "${CLUSTER_NAME}-amp-grafana-policy" \
  --policy-document "{\"Version\": \"2012-10-17\", \"Statement\": [{\"Sid\": \"AllowAMPReadWrite\", \"Effect\": \"Allow\", \"Action\": [\"aps:ListWorkspaces\", \"aps:DescribeWorkspace\", \"aps:GetMetricMetadata\", \"aps:GetSeries\", \"aps:QueryMetrics\", \"aps:RemoteWrite\", \"aps:GetLabels\"], \"Resource\": \"arn:aws:aps:${AWS_REGION}:${ACCOUNT_ID}:workspace/*\"}, {\"Sid\": \"AllowCloudWatchMetrics\", \"Effect\": \"Allow\", \"Action\": [\"cloudwatch:DescribeAlarmsForMetric\", \"cloudwatch:ListMetrics\", \"cloudwatch:GetMetricData\", \"cloudwatch:GetMetricStatistics\"], \"Resource\": \"*\"}]}" \
  --query 'Policy.Arn' \
  --output text)

echo "AMP Policy ARN: ${AMP_POLICY_ARN}"
Créez l'espace de noms de surveillance et les comptes de service pour Prometheus et Grafana :
kubectl create namespace monitoring
kubectl create serviceaccount amp-iamproxy-ingest-service-account -n monitoring
kubectl create serviceaccount grafana-sa -n monitoring
Créez des associations d'identité EKS Pod pour lier les comptes de service à la politique IAM :
eksctl create podidentityassociation \
  --cluster ${CLUSTER_NAME} \
  --namespace monitoring \
  --service-account-name amp-iamproxy-ingest-service-account \
  --role-name "${CLUSTER_NAME}-amp-ingest-role" \
  --permission-policy-arns ${AMP_POLICY_ARN} \
  --region ${AWS_REGION}

eksctl create podidentityassociation \
  --cluster ${CLUSTER_NAME} \
  --namespace monitoring \
  --service-account-name grafana-sa \
  --role-name "${CLUSTER_NAME}-grafana-role" \
  --permission-policy-arns ${AMP_POLICY_ARN} \
  --region ${AWS_REGION}
Vérifiez que les deux associations EKS Pod Identity ont été créées :
eksctl get podidentityassociation --cluster ${CLUSTER_NAME} --region ${AWS_REGION}
La sortie attendue doit inclure les deux amp-iamproxy-ingest-service-account et grafana-sa dans l'espace de monitoring noms.
Installer kube-prometheus-stack
Ajoutez le dépôt Helm :
helm repo add prometheus-community https://prometheus-community.github.io/helm-charts
helm repo update
Ce fichier de valeurs omet un NodeSelector pour Prometheus, Grafana et l'opérateur : l'altération des nœuds GPU les empêche d'accéder aux nœuds nvidia.com/gpu:NoSchedule GPU, de sorte qu'ils atterrissent par défaut sur le système ou sur le pool à usage général. Node-exporter utilise une tolérance par caractères génériques afin de s'exécuter sur tous les nœuds, y compris les nœuds GPU, afin de collecter des métriques à l'échelle du parc.
Créez le fichier de valeurs :
Exemple fichier de valeurs kube-prometheus-stack
cat << EOF > /tmp/kube-prometheus-values.yaml
alertmanager:
  enabled: false

prometheus-adapter:
  enabled: false

prometheus:
  serviceAccount:
    create: false
    name: amp-iamproxy-ingest-service-account
  prometheusSpec:
    serviceAccountName: amp-iamproxy-ingest-service-account
    enableRemoteWriteReceiver: true
    retention: 2h
    scrapeInterval: 30s
    evaluationInterval: 30s
    podMonitorSelectorNilUsesHelmValues: false
    serviceMonitorSelectorNilUsesHelmValues: false
    resources:
      requests:
        cpu: 500m
        memory: 1Gi
      limits:
        memory: 8Gi
    remoteWrite:
      - url: "${AMP_ENDPOINT}api/v1/remote_write"
        sigv4:
          region: "${AWS_REGION}"
        queueConfig:
          maxSamplesPerSend: 1000
          maxShards: 200
          capacity: 2500
    nodeSelector:
      node-role: system

prometheusOperator:
  resources:
    requests:
      cpu: 100m
      memory: 128Mi
    limits:
      memory: 256Mi
  nodeSelector:
    node-role: system
  admissionWebhooks:
    patch:
      nodeSelector:
        node-role: system

kube-state-metrics:
  resources:
    requests:
      cpu: 50m
      memory: 128Mi
    limits:
      memory: 512Mi
  nodeSelector:
    node-role: system

grafana:
  enabled: true
  serviceAccount:
    create: false
    name: grafana-sa
  resources:
    requests:
      cpu: 100m
      memory: 256Mi
    limits:
      memory: 1Gi
  nodeSelector:
    node-role: system
  grafana.ini:
    auth.sigv4:
      enabled: true
  sidecar:
    datasources:
      defaultDatasourceEnabled: false
  plugins:
    - grafana-amazonprometheus-datasource
  additionalDataSources:
    - name: Amazon-Managed-Prometheus
      type: grafana-amazonprometheus-datasource
      access: proxy
      url: "${AMP_ENDPOINT}"
      isDefault: true
      jsonData:
        sigV4Auth: true
        defaultRegion: "${AWS_REGION}"
        sigV4Region: "${AWS_REGION}"
      editable: true
  dashboardProviders:
    dashboardproviders.yaml:
      apiVersion: 1
      providers:
        - name: default
          orgId: 1
          folder: 'GPU Monitoring'
          type: file
          disableDeletion: false
          editable: true
          options:
            path: /var/lib/grafana/dashboards/default
  dashboards:
    default:
      nvidia-dcgm:
        gnetId: 25261
        revision: 1
        datasource:
          - name: DS_PROMETHEUS
            value: Amazon-Managed-Prometheus
      vllm:
        gnetId: 25263
        revision: 1
        datasource:
          - name: DS_PROMETHEUS
            value: Amazon-Managed-Prometheus
      vllm-load-analysis:
        gnetId: 25494
        revision: 1
        datasource:
          - name: DS_PROMETHEUS
            value: Amazon-Managed-Prometheus

prometheus-node-exporter:
  resources:
    requests:
      cpu: 50m
      memory: 64Mi
    limits:
      memory: 128Mi
  tolerations:
    - operator: Exists
EOF
Vérifiez que les variables ont été correctement renseignées :
grep -E "url:|region:" /tmp/kube-prometheus-values.yaml
Vous devriez voir l'URL complète du point de terminaison AMP (en commençant parhttps://aps-workspaces…) et votre région. Si l'un des deux est vide, réexportez les variables et recréez le fichier.
Installez le graphique :
helm install kube-prometheus-stack prometheus-community/kube-prometheus-stack \
  --namespace monitoring \
  -f /tmp/kube-prometheus-values.yaml
Vérifiez que les pods fonctionnent :
kubectl get pods -n monitoring
Sortie attendue :
NAME                                                       READY   STATUS    RESTARTS   AGE
kube-prometheus-stack-grafana-7c58f54f77-rftrj             3/3     Running   0          4m
kube-prometheus-stack-kube-state-metrics-d68dcbc84-5smxq   1/1     Running   0          4m
kube-prometheus-stack-operator-5895df479f-ttm47            1/1     Running   0          4m
kube-prometheus-stack-prometheus-node-exporter-t9q7s       1/1     Running   0          4m
kube-prometheus-stack-prometheus-node-exporter-x6vfb       1/1     Running   0          4m
prometheus-kube-prometheus-stack-prometheus-0              2/2     Running   0          4m
La pile déploie les composants suivants :
-
Prometheus StatefulSet () : supprime les métriques et les écrit à distance dans AMP
-
Grafana : tableaux de bord et visualisation, préconfigurés avec la source de données AMP
-
kube-state-metrics : génère des métriques sur l'état des objets Kubernetes (état du pod, ressource, états) requests/limits NodeClaim
-
node-exporter (DaemonSetun par nœud) : collecte les métriques au niveau de l'hôte (processeur, mémoire, disque, réseau)
-
opérateur : gère les ressources personnalisées Prometheus et Alertmanager
Le gestionnaire d'alertes est désactivé dans cette configuration.
Accédez à Grafana
Ouvrez un terminal séparé et redirigez le port pour accéder à Grafana :
kubectl port-forward svc/kube-prometheus-stack-grafana 3000:80 -n monitoring
Ouvrez http://localhost:3000admin et le mot de passe à l'aide de la commande suivante :
kubectl --namespace monitoring get secrets kube-prometheus-stack-grafana -o jsonpath="{.data.admin-password}" | base64 -d ; echo
Pour vérifier que le pipeline de métriques fonctionne de bout en bout :
-
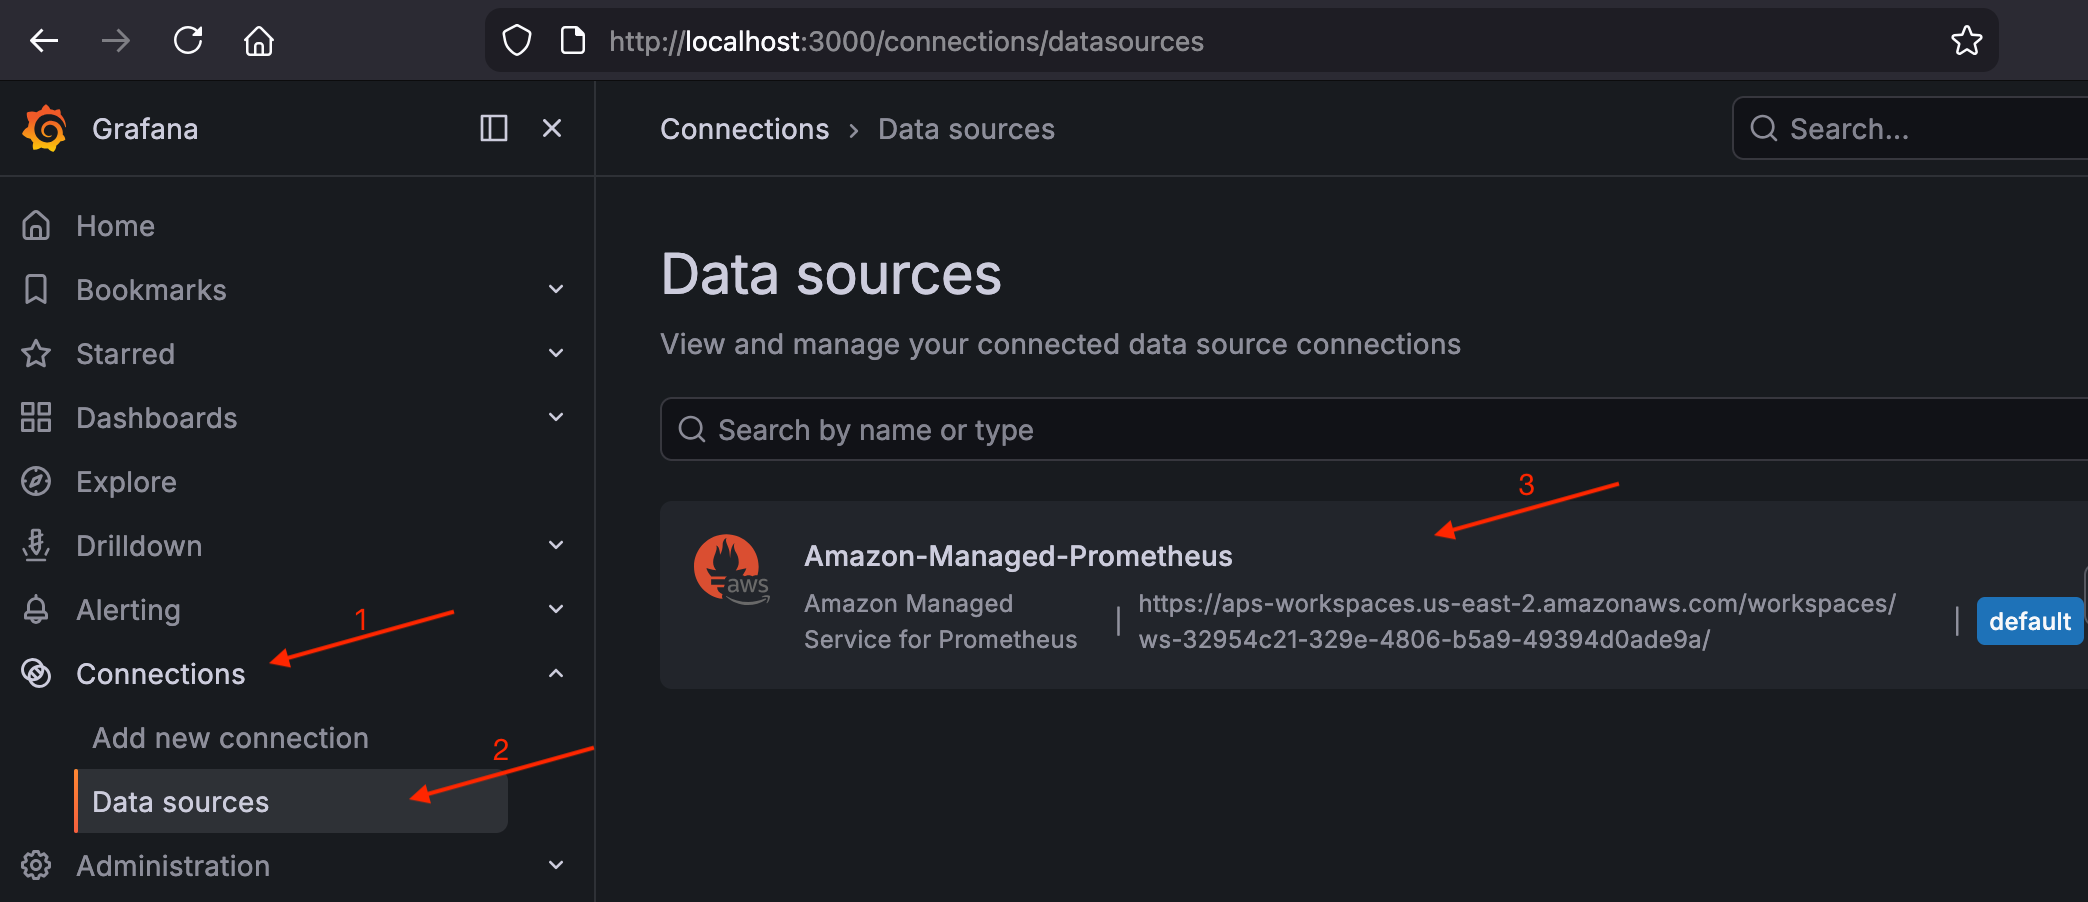
Accédez à Connexions > Sources de données et confirmez qu'elle
Amazon-Managed-Prometheusest répertoriée comme source de données par défaut.Valider la source de données AMP dans Grafana
-
Accédez à Drilldown > Mesures et recherchez la
upmétrique. Vous devriez voir les résultats des cibles de scrape de votre cluster.Validez la
upmétrique dans Grafana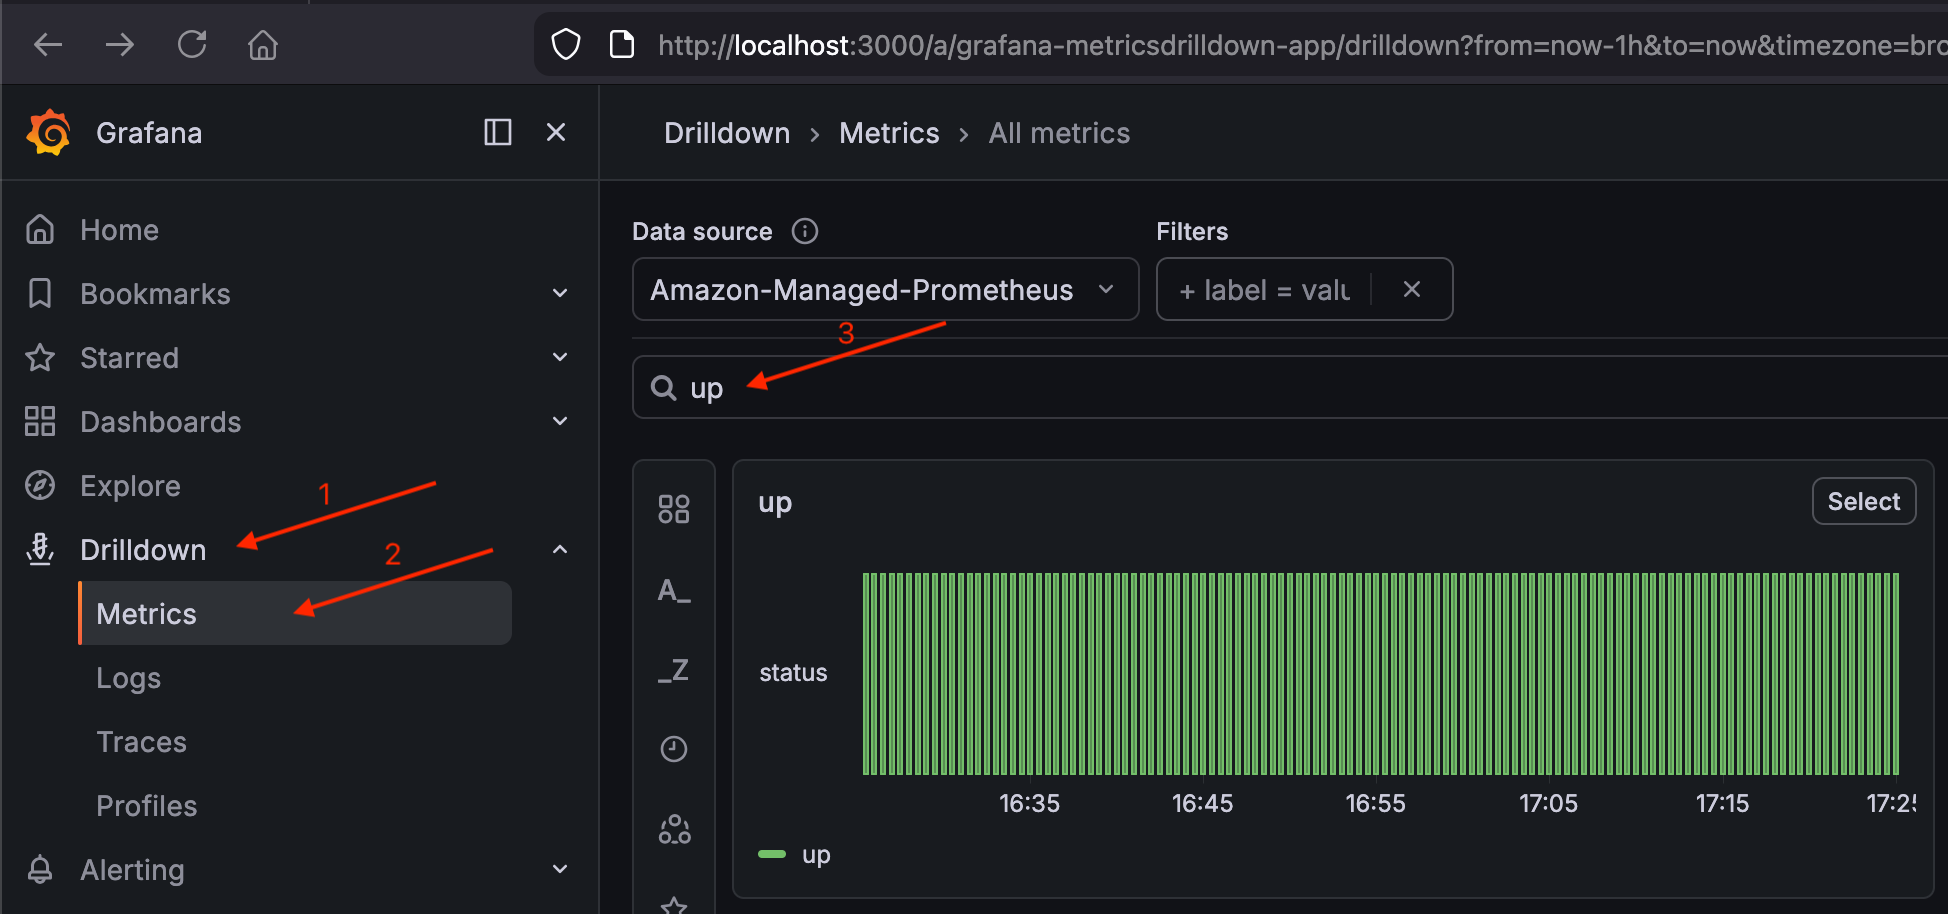
S'il up affiche des résultats, le pipeline (cluster → Prometheus → AMP → Grafana) fonctionne.
Déployez l'exportateur DCGM pour les métriques du GPU
Le kube-prometheus-stack collecte les métriques du processeur et de la mémoire au niveau du nœud, mais pas les métriques du GPU. L'exportateur NVIDIA DCGM ajoute l'utilisation du GPU, l'utilisation de la mémoire, la température, la consommation d'énergie, la bande passante NVLink et l'activité des tenseurs.
helm repo add gpu-helm-charts https://nvidia.github.io/dcgm-exporter/helm-charts
helm repo update
Définissez la clé de sélection du nœud GPU pour votre trajectoire. Le mode automatique EKS et Karpenter autogéré utilisent des clés d'étiquette différentes selon le fabricant du GPU.
Créez le fichier de valeurs de l'exportateur DCGM :
Exemple fichier de valeurs dcgm-exporter
cat << EOF > /tmp/dcgm-exporter-values.yaml
resources:
  requests:
    memory: "512Mi"
    cpu: "100m"
  limits:
    memory: "1Gi"
    cpu: "500m"

serviceMonitor:
  enabled: true
  additionalLabels:
    release: kube-prometheus-stack

nodeSelector:
  ${GPU_NODE_SELECTOR_KEY}: nvidia

tolerations:
  - key: "nvidia.com/gpu"
    operator: "Exists"
    effect: "NoSchedule"

customMetrics: |
  # Clocks
  DCGM_FI_DEV_SM_CLOCK,  gauge, SM clock frequency (in MHz).
  DCGM_FI_DEV_MEM_CLOCK, gauge, Memory clock frequency (in MHz).
  # Temperature
  DCGM_FI_DEV_MEMORY_TEMP, gauge, Memory temperature (in C).
  DCGM_FI_DEV_GPU_TEMP,    gauge, GPU temperature (in C).
  # Power
  DCGM_FI_DEV_POWER_USAGE,              gauge, Power draw (in W).
  DCGM_FI_DEV_TOTAL_ENERGY_CONSUMPTION, counter, Total energy consumption since boot (in mJ).
  # PCIe
  DCGM_FI_PROF_PCIE_TX_BYTES,  counter, Number of bytes transmitted through PCIe TX (in KB) via NVML.
  DCGM_FI_PROF_PCIE_RX_BYTES,  counter, Number of bytes received through PCIe RX (in KB) via NVML.
  DCGM_FI_DEV_PCIE_REPLAY_COUNTER, counter, Total number of PCIe retries.
  # Utilization (the sample period varies depending on the product)
  DCGM_FI_DEV_GPU_UTIL,      gauge, GPU utilization (in %).
  DCGM_FI_DEV_MEM_COPY_UTIL, gauge, Memory utilization (in %).
  DCGM_FI_DEV_ENC_UTIL,      gauge, Encoder utilization (in %).
  DCGM_FI_DEV_DEC_UTIL,      gauge, Decoder utilization (in %).
  # Errors and violations
  DCGM_FI_DEV_XID_ERRORS,            gauge, Value of the last XID error encountered.
  DCGM_EXP_XID_ERRORS_COUNT,         gauge, Value of count of XID errors encountered.
  DCGM_FI_DEV_POWER_VIOLATION,       counter, Throttling duration due to power constraints (in us).
  DCGM_FI_DEV_THERMAL_VIOLATION,     counter, Throttling duration due to thermal constraints (in us).
  DCGM_FI_DEV_SYNC_BOOST_VIOLATION,  counter, Throttling duration due to sync-boost constraints (in us).
  DCGM_FI_DEV_BOARD_LIMIT_VIOLATION, counter, Throttling duration due to board limit constraints (in us).
  DCGM_FI_DEV_LOW_UTIL_VIOLATION,    counter, Throttling duration due to low utilization (in us).
  DCGM_FI_DEV_RELIABILITY_VIOLATION, counter, Throttling duration due to reliability constraints (in us).
  # Memory usage
  DCGM_FI_DEV_FB_FREE, gauge, Framebuffer memory free (in MiB).
  DCGM_FI_DEV_FB_USED, gauge, Framebuffer memory used (in MiB).
  # Retired pages
  DCGM_FI_DEV_RETIRED_SBE,     counter, Total number of retired pages due to single-bit errors.
  DCGM_FI_DEV_RETIRED_DBE,     counter, Total number of retired pages due to double-bit errors.
  DCGM_FI_DEV_RETIRED_PENDING, counter, Total number of pages pending retirement.
  # NVLink
  DCGM_FI_DEV_NVLINK_BANDWIDTH_TOTAL, counter, Total number of NVLink bandwidth counters for all lanes.
  DCGM_FI_PROF_NVLINK_TX_BYTES,       counter, The rate of data transmitted over NVLink not including protocol headers in bytes per second.
  DCGM_FI_PROF_NVLINK_RX_BYTES,       counter, The rate of data received over NVLink not including protocol headers in bytes per second.
  # DCP metrics
  DCGM_FI_PROF_GR_ENGINE_ACTIVE,   gauge, Ratio of time the graphics engine is active (in %).
  DCGM_FI_PROF_SM_ACTIVE,          gauge, The ratio of cycles an SM has at least 1 warp assigned (in %).
  DCGM_FI_PROF_SM_OCCUPANCY,       gauge, The ratio of number of warps resident on an SM (in %).
  DCGM_FI_PROF_PIPE_TENSOR_ACTIVE, gauge, Ratio of cycles the tensor (HMMA) pipe is active (in %).
  DCGM_FI_PROF_DRAM_ACTIVE,        gauge, Ratio of cycles the device memory interface is active sending or receiving data (in %).
  DCGM_FI_DEV_CLOCK_THROTTLE_REASONS, gauge, Current clock throttle reasons (bitmask of DCGM_CLOCKS_THROTTLE_REASON_*).
  DCGM_FI_DEV_GPU_NVLINK_ERRORS,      gauge, Identifies a GPU NVLink error type returned by DCGM_FI_DEV_GPU_NVLINK_ERRORS.
  ## NVLink
  DCGM_FI_DEV_NVLINK_BANDWIDTH_L0, counter, The number of bytes of active NVLink rx or tx data including both header and payload.
  ## Remapped rows
  DCGM_FI_DEV_UNCORRECTABLE_REMAPPED_ROWS, counter, Number of remapped rows for uncorrectable errors.
  DCGM_FI_DEV_CORRECTABLE_REMAPPED_ROWS, counter, Number of remapped rows for correctable errors.
  DCGM_FI_DEV_ROW_REMAP_FAILURE, gauge, whether remapping of rows has failed.
  ## Profiling metrics
  DCGM_FI_PROF_PIPE_FP64_ACTIVE, gauge, Ratio of cycles the fp64 pipes are active (in %).
  DCGM_FI_PROF_PIPE_FP32_ACTIVE, gauge, Ratio of cycles the fp32 pipes are active (in %).
  DCGM_FI_PROF_PIPE_FP16_ACTIVE, gauge, Ratio of cycles the fp16 pipes are active (in %).
  # ECC
  DCGM_FI_DEV_ECC_SBE_VOL_TOTAL, counter, Total number of single-bit volatile ECC errors.
  DCGM_FI_DEV_ECC_DBE_VOL_TOTAL, counter, Total number of double-bit volatile ECC errors.
EOF
Le customMetrics champ remplace l'ensemble de mesures par défaut de l'exportateur DCGM par un ensemble étendu qui inclut la bande passante NVLink, l'activité des tenseurs, le débit PCIe, les erreurs ECC et la régulation thermique. Pour les charges de travail d'inférence, elles vous aident à déterminer si les unités de calcul du processeur graphique sont pleinement utilisées, si le processeur graphique est inactif entre les demandes en raison de la faible taille des lots, si le transfert de données entre le processeur et le processeur graphique constitue un goulot d'étranglement, si le ralentissement thermique est à l'origine des pics de latence et quelle est la marge de mémoire restante pour les lots plus importants.
Installez l'exportateur DCGM :
helm install dcgm-exporter gpu-helm-charts/dcgm-exporter \
  --namespace monitoring \
  -f /tmp/dcgm-exporter-values.yaml
tolerationsAutorisez l'exportateur à s'exécuter sur les GPU-tainted nœuds que vous avez provisionnés à l'étape 2. L'release: kube-prometheus-stackétiquette permet serviceMonitor à Prometheus de le découvrir et de le gratter automatiquement.
Vérifiez l'exportateur DaemonSet DCGM :
kubectl get daemonset dcgm-exporter -n monitoring
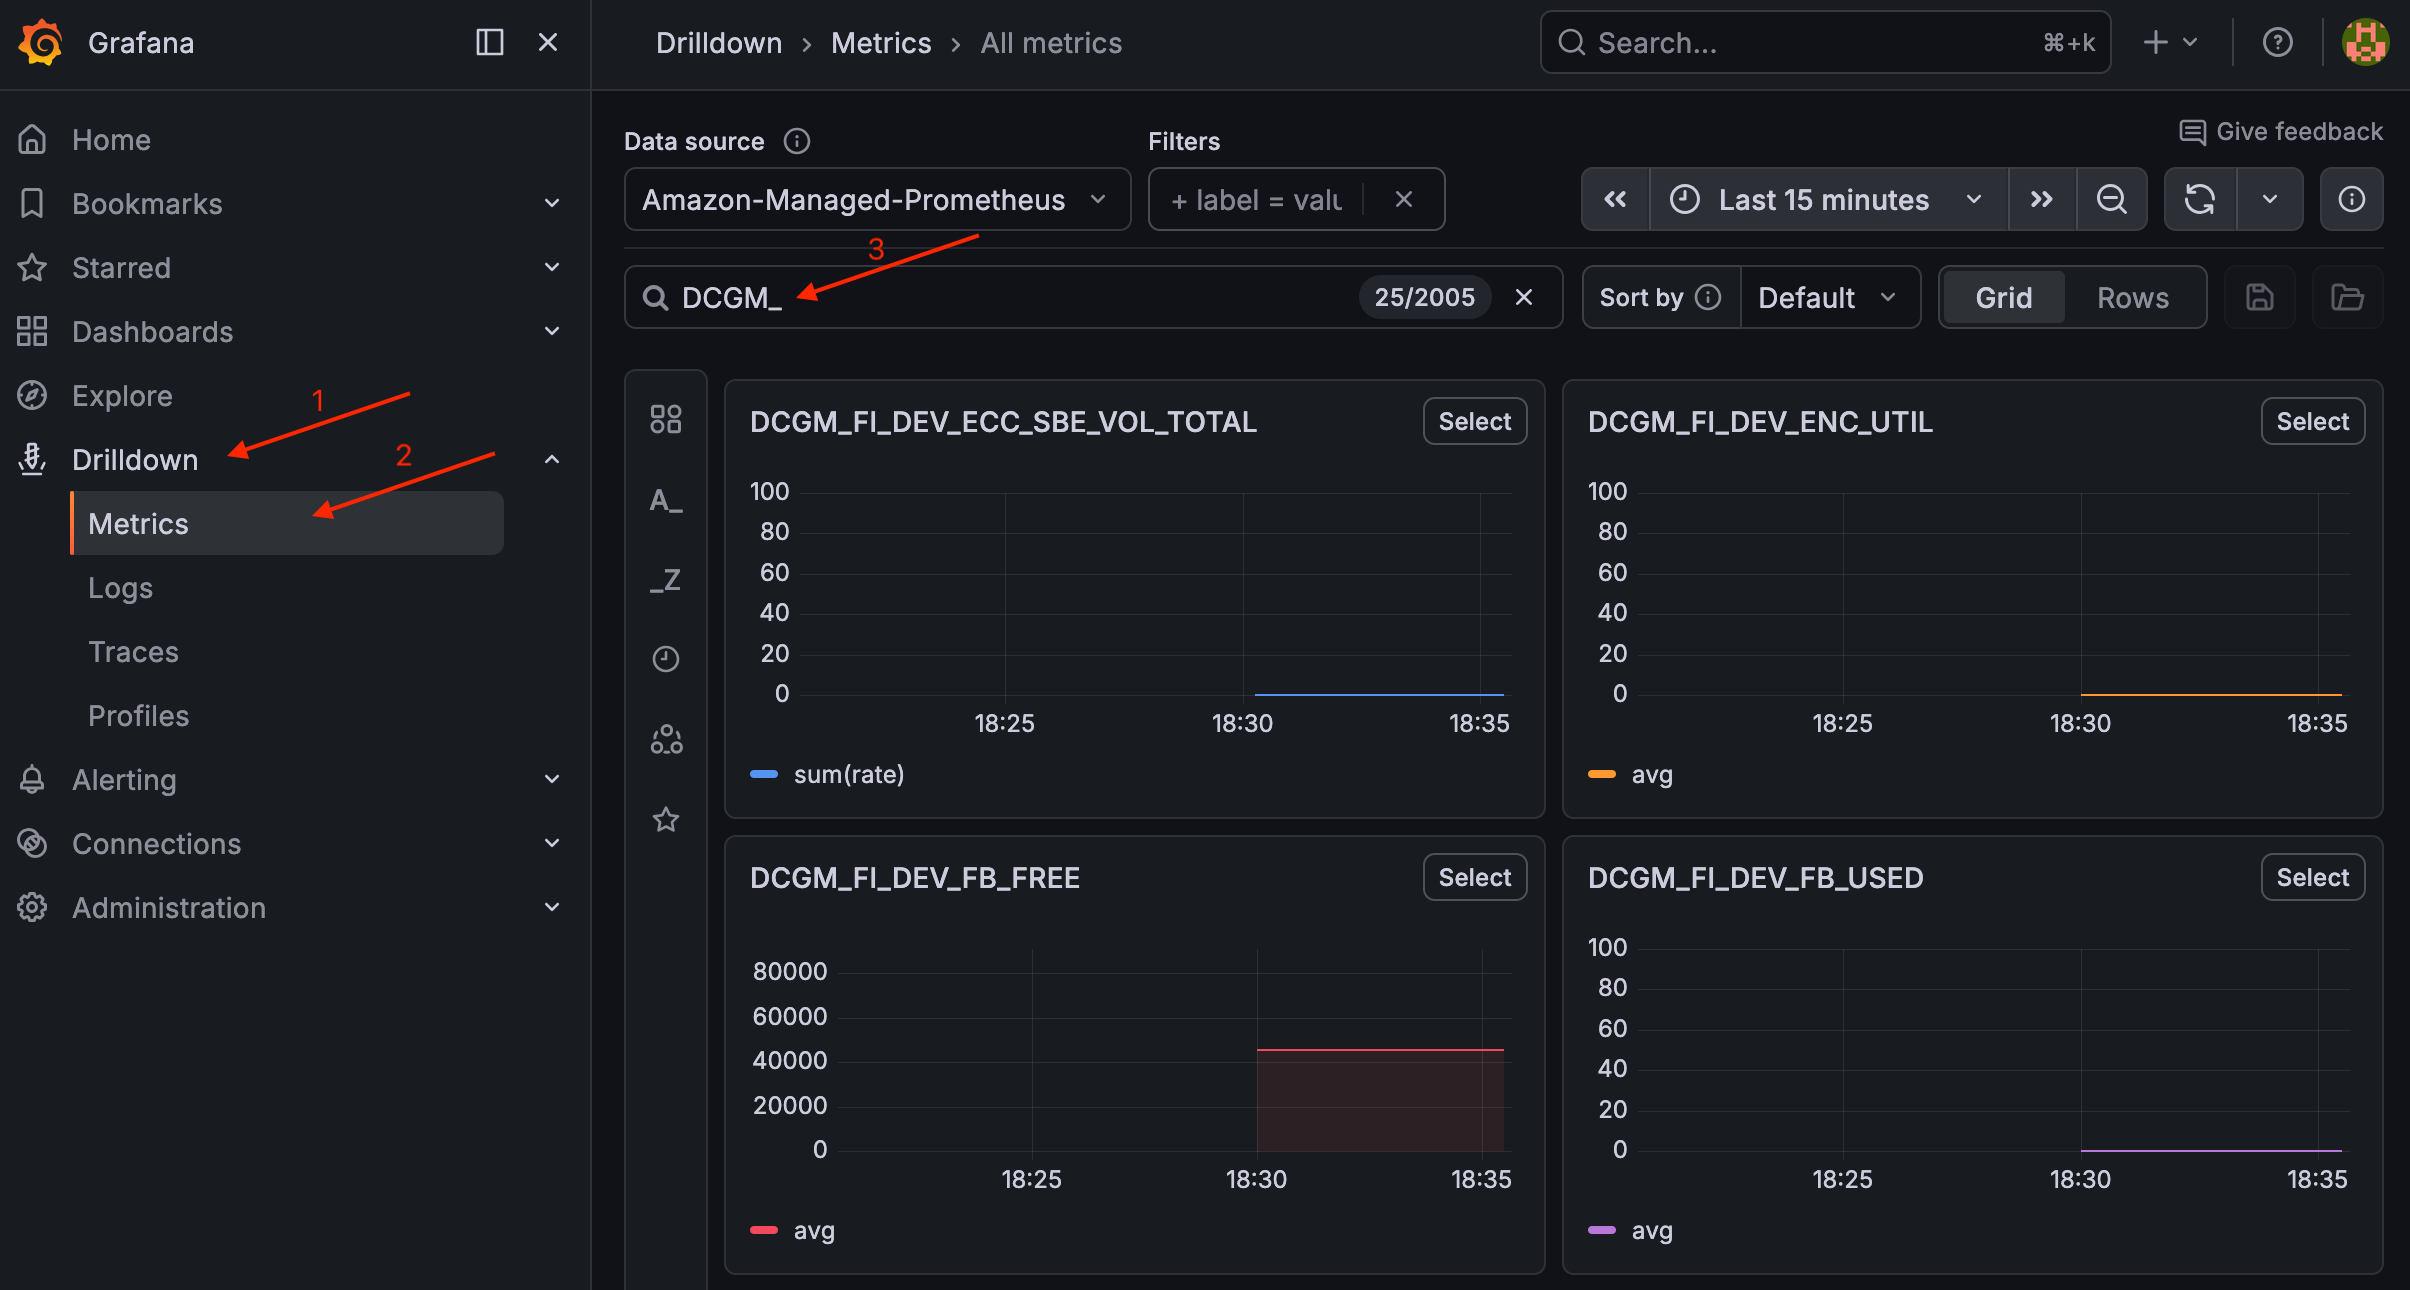
Une fois qu'un nœud GPU est en cours d'exécution, vous devriez voir un pod prêt. Pour valider les métriques DCGM, accédez à Drilldown > Metrics in Grafana et recherchez. DCGM_
Valider les métriques DCGM dans Grafana
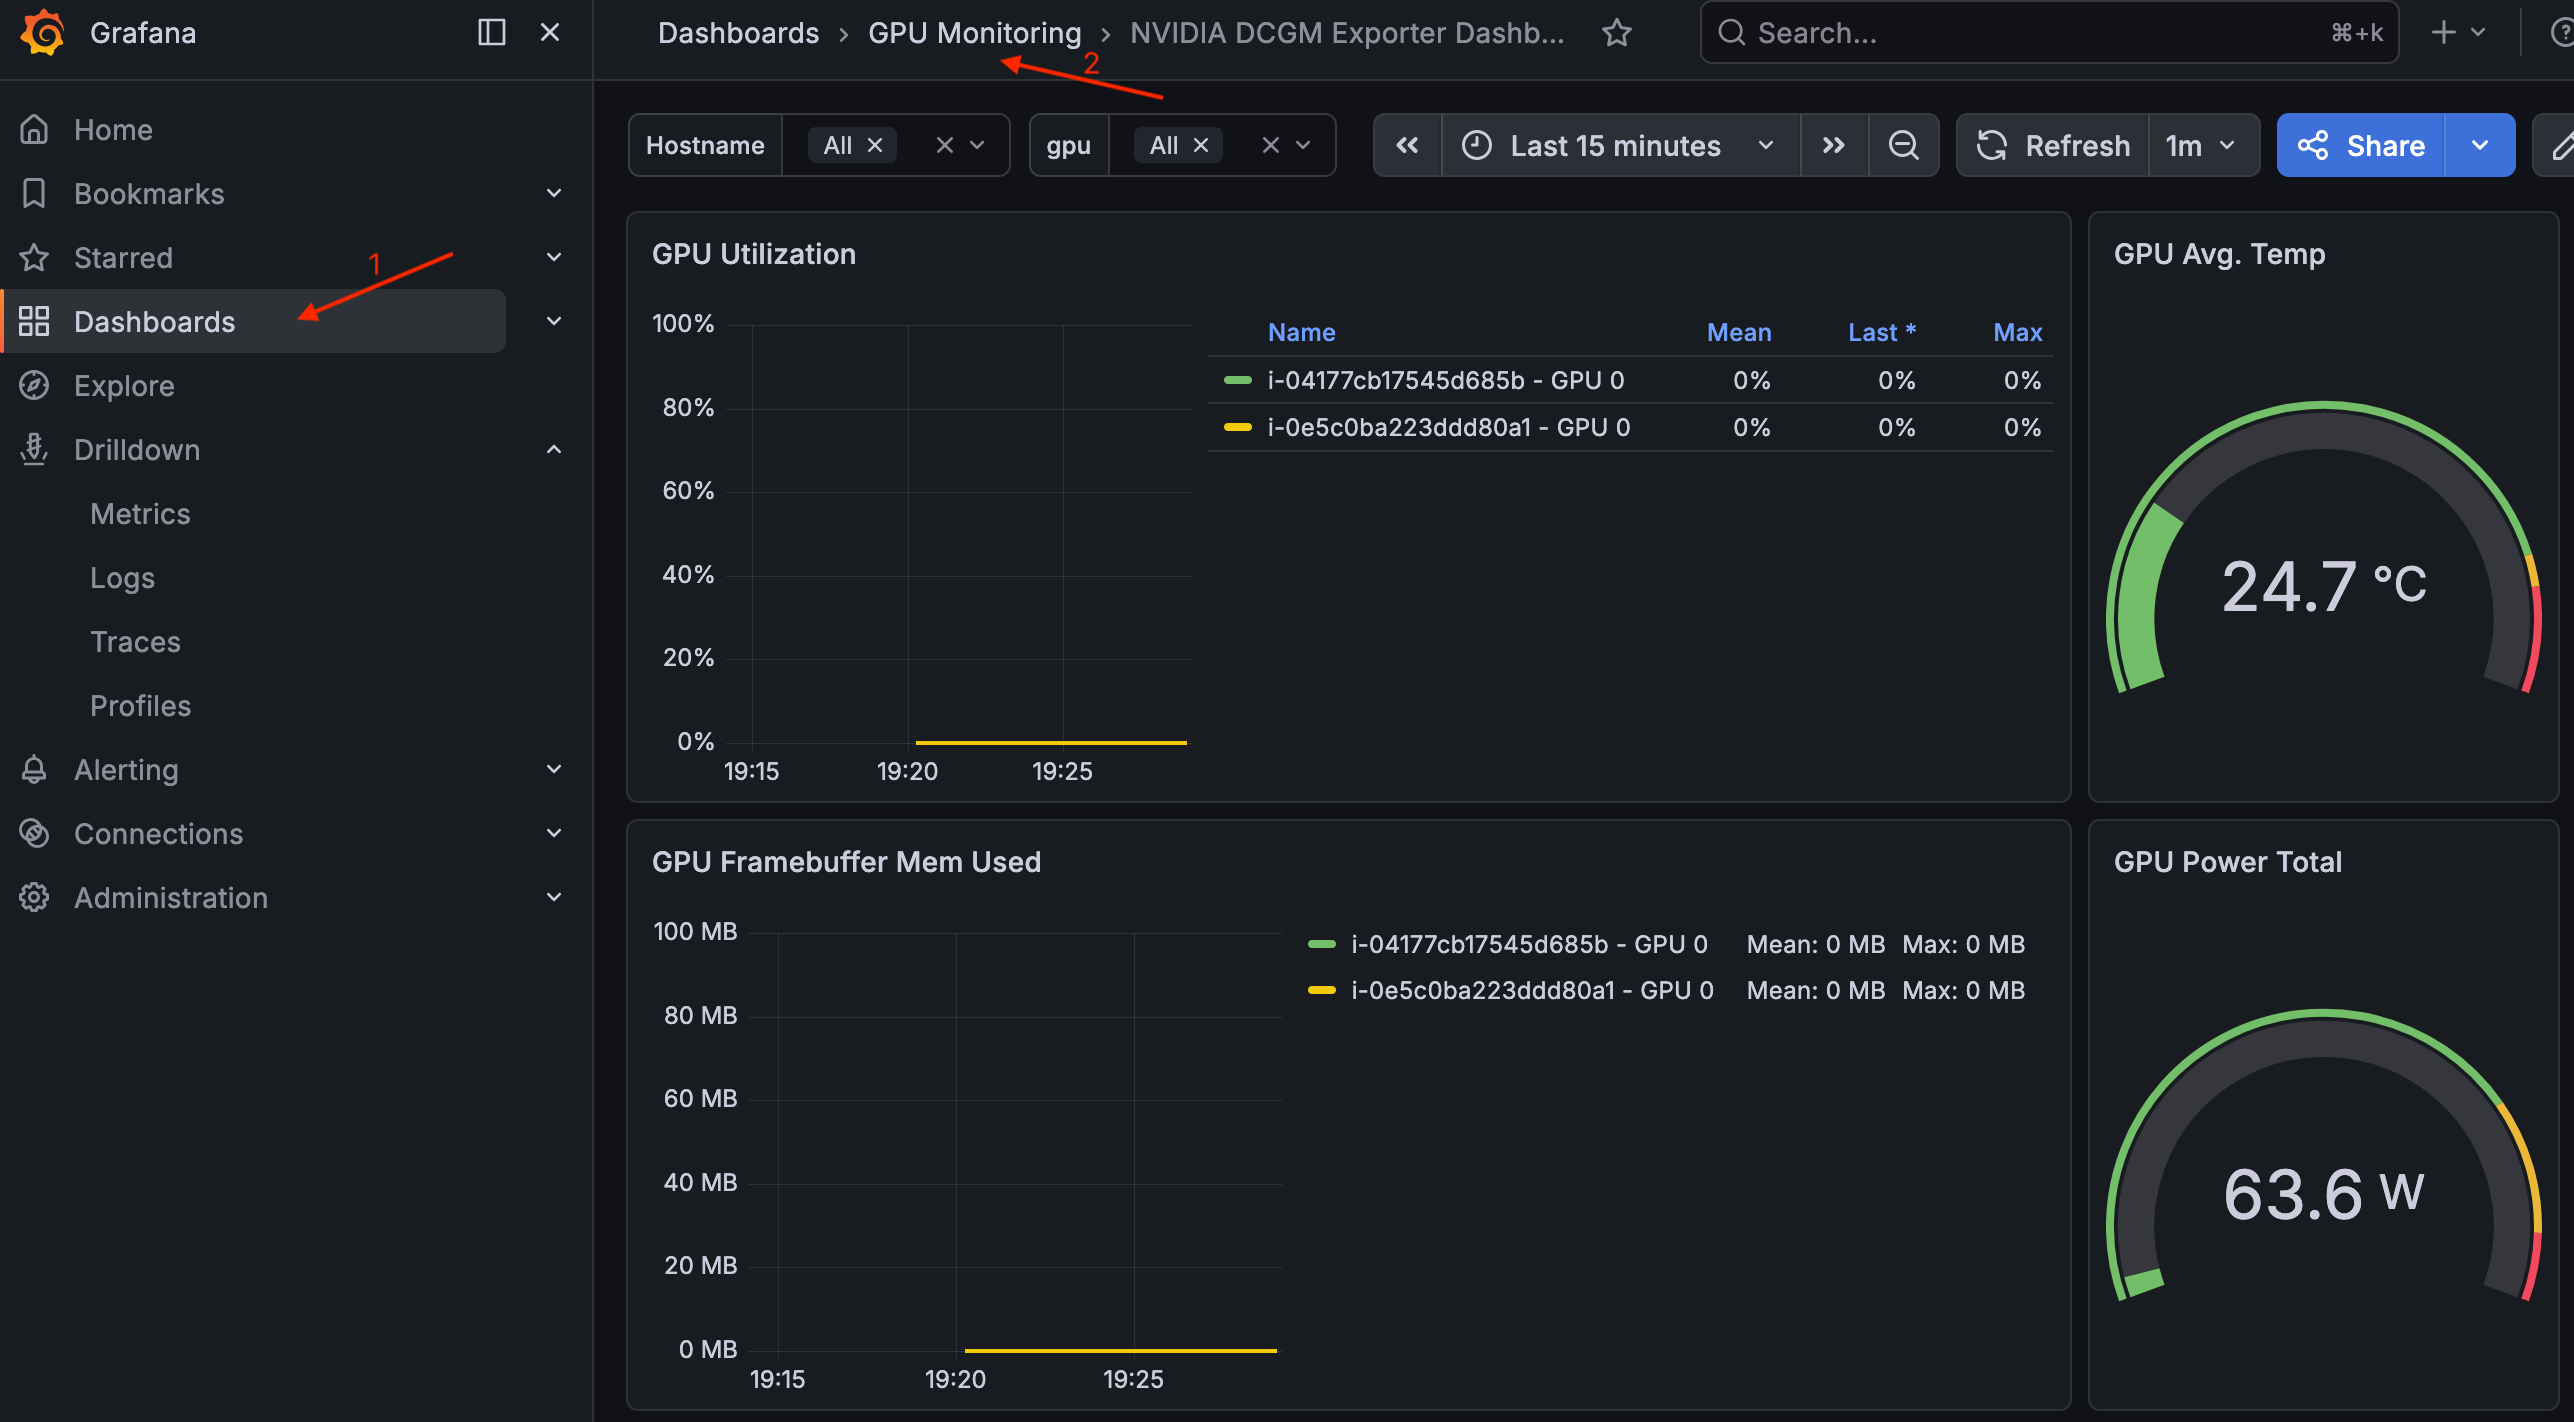
Pour consulter le tableau de bord, accédez à Tableaux de bord > Surveillance du GPU > Tableau de bord NVIDIA DCGM Exporter.
Tableau de bord NVIDIA DCGM Exporter à Grafana
Poids du modèle : seau S3
Créez un compartiment Amazon S3 pour stocker les poids des modèles et configurez une association d'identité EKS Pod afin que les pods de charge de travail puissent y lire et écrire.
Si vous avez ouvert un nouveau terminal, définissez le nom et la région du cluster :
export CLUSTER_NAME=ai-eks-docs
export AWS_REGION=us-east-2
Création du compartiment S3
Créez le bucket avec un suffixe aléatoire pour éviter les collisions de noms :
BUCKET_SUFFIX=$(head -c 4 /dev/urandom | od -An -tx1 | tr -d ' \n')
MODEL_BUCKET="${CLUSTER_NAME}-models-${BUCKET_SUFFIX}"

aws s3 mb s3://${MODEL_BUCKET} --region ${AWS_REGION}
Le chiffrement côté serveur (AES256) et le blocage de l'accès public sont activés par défaut pour les compartiments S3 créés après janvier 2023.
Configurer EKS Pod Identity pour l'accès à S3
Créez une politique IAM étendue au bucket du modèle model-storage-sa ServiceAccount dans l'defaultespace de noms et une association d'identité EKS Pod qui les relie. Les pods de charge de travail définis serviceAccountName: model-storage-sa pourront lire et écrire dans le compartiment.
kubectl create serviceaccount model-storage-sa
Créez la politique IAM :
POLICY_ARN=$(aws iam create-policy \
  --policy-name "${CLUSTER_NAME}-model-storage-policy" \
  --policy-document "{\"Version\": \"2012-10-17\", \"Statement\": [{\"Effect\": \"Allow\", \"Action\": [\"s3:GetObject\", \"s3:PutObject\", \"s3:ListBucket\", \"s3:DeleteObject\"], \"Resource\": [\"arn:aws:s3:::${MODEL_BUCKET}\", \"arn:aws:s3:::${MODEL_BUCKET}/*\"]}]}" \
  --query 'Policy.Arn' \
  --output text)

echo "Policy ARN: ${POLICY_ARN}"
Note
Cette politique accorde s3:DeleteObject et s3:PutObject pour l'étape de validation. Pour les modules d'inférence de production qui ne lisent que le poids des modèles, supprimez-les s3:PutObject et respectez le s3:DeleteObject principe du moindre privilège.
Créez l'association EKS Pod Identity. eksctlcrée le rôle IAM avec la bonne politique de confiance et le ServiceAccount lie à :
eksctl create podidentityassociation \
  --cluster ${CLUSTER_NAME} \
  --namespace default \
  --service-account-name model-storage-sa \
  --role-name "${CLUSTER_NAME}-model-storage-role" \
  --permission-policy-arns ${POLICY_ARN} \
  --region ${AWS_REGION}
Vérifiez l'association :
eksctl get podidentityassociation --cluster ${CLUSTER_NAME} --region ${AWS_REGION}
La sortie doit inclure l'model-storage-saassociation dans l'espace de default noms.
Exécutez un pod unique avec l'image AWS CLI, en utilisant le model-storage-sa ServiceAccount, pour confirmer que EKS Pod Identity est câblé et que l'accès au S3 fonctionne :
cat << EOF | kubectl apply -f -
apiVersion: v1
kind: Pod
metadata:
  name: s3-test
  labels:
    guide: ai-eks-docs
spec:
  serviceAccountName: model-storage-sa
  containers:
    - name: aws-cli
      image: public.ecr.aws/aws-cli/aws-cli:2.27.0
      command:
        - sh
        - -c
        - |
          echo "=== Caller Identity ==="
          aws sts get-caller-identity
          echo ""
          echo "=== S3 Write Test ==="
          echo "pod identity works" | aws s3 cp - s3://${MODEL_BUCKET}/test.txt
          echo ""
          echo "=== S3 List Test ==="
          aws s3 ls s3://${MODEL_BUCKET}/
          echo ""
          echo "=== S3 Delete Test ==="
          aws s3 rm s3://${MODEL_BUCKET}/test.txt
  restartPolicy: Never
EOF
Attendez que le Pod soit terminé et consultez les journaux :
kubectl wait --for=jsonpath='{.status.phase}'=Succeeded pod/s3-test --timeout=300s
kubectl logs s3-test
Sortie attendue :
=== Caller Identity ===
{
    "UserId": "AROA...:eks-ai-eks-docs-model-s-...",
    "Account": "123456789012",
    "Arn": "arn:aws:sts::123456789012:assumed-role/ai-eks-docs-model-storage-role/eks-ai-eks-docs-model-s-..."
}

=== S3 Write Test ===
upload: - to s3://ai-eks-docs-models-01234567/test.txt

=== S3 List Test ===
2026-05-04 12:00:00         19 test.txt

=== S3 Delete Test ===
delete: s3://ai-eks-docs-models-01234567/test.txt
L'identité de l'appelant confirme que le Pod a assumé le ${CLUSTER_NAME}-model-storage-role rôle via EKS Pod Identity. Les commandes S3 confirment l'accès en lecture et en écriture.
Nettoyez le module de test :
kubectl delete pod s3-test
Étapes suivantes
Une fois votre cluster prêt, vous pouvez passer au modèle Load & Serve pour déployer un grand modèle de langage et interagir avec le point de terminaison d'inférence.
Nettoyage
Astuce
Si vous comptez poursuivre avec les sections suivantes de ce guide, ignorez le nettoyage complet. Ne le lancez que lorsque vous avez terminé.
export CLUSTER_NAME=ai-eks-docs
export AWS_REGION=us-east-2
kubectl delete pod nvidia-smi --ignore-not-found
kubectl delete deployment gpu-overflow-test --ignore-not-found
Si vous avez créé un ODCR, annulez-le d'abord. Recherchez le numéro de réservation :
INSTANCE_TYPE="g6e.4xlarge"
CAPACITY_RESERVATION_ID=$(aws ec2 describe-capacity-reservations \
  --filters "Name=state,Values=active" "Name=instance-type,Values=${INSTANCE_TYPE}" \
  --query 'CapacityReservations[0].CapacityReservationId' \
  --output text \
  --region ${AWS_REGION})
echo "Capacity reservation ID: ${CAPACITY_RESERVATION_ID}"
Annuler la réservation :
aws ec2 cancel-capacity-reservation --capacity-reservation-id ${CAPACITY_RESERVATION_ID}
Important
L'annulation d'une réservation ne met pas fin à l'exécution des instances. Ils se poursuivent aux On-Demand taux standard jusqu'à leur résiliation. Supprimez d'abord le déploiement pour vider le nœud réservé avant de l'annuler.
Recherchez l'ARN de la politique IAM :
AMP_POLICY_ARN=$(aws iam list-policies \
  --scope Local \
  --query "Policies[?PolicyName=='${CLUSTER_NAME}-amp-grafana-policy'].Arn" \
  --output text)
echo "AMP Policy ARN: ${AMP_POLICY_ARN}"
Recherchez l'identifiant de l'espace de travail AMP :
AMP_WORKSPACE_ID=$(aws amp list-workspaces \
  --alias "amp-ws-${CLUSTER_NAME}" \
  --query 'workspaces[0].workspaceId' \
  --output text \
  --region ${AWS_REGION})
echo "AMP Workspace ID: ${AMP_WORKSPACE_ID}"
Désinstallez la version Helm de l'exportateur DCGM :
helm uninstall dcgm-exporter -n monitoring
Désinstallez la version Helm de kube-prometheus-stack :
helm uninstall kube-prometheus-stack -n monitoring
Supprimez l'association EKS Pod Identity pour le compte du service d'ingestion Prometheus :
eksctl delete podidentityassociation \
  --cluster ${CLUSTER_NAME} \
  --namespace monitoring \
  --service-account-name amp-iamproxy-ingest-service-account \
  --region ${AWS_REGION}
Supprimez l'association EKS Pod Identity pour le compte de service Grafana :
eksctl delete podidentityassociation \
  --cluster ${CLUSTER_NAME} \
  --namespace monitoring \
  --service-account-name grafana-sa \
  --region ${AWS_REGION}
Supprimez la politique IAM utilisée par Prometheus et Grafana :
aws iam delete-policy --policy-arn ${AMP_POLICY_ARN}
Supprimez l'espace de travail AMP :
aws amp delete-workspace --workspace-id ${AMP_WORKSPACE_ID} --region ${AWS_REGION}
Supprimez l'espace de noms de surveillance :
kubectl delete namespace monitoring
Recherchez le nom du bucket du modèle :
MODEL_BUCKET=$(aws s3api list-buckets \
  --query "Buckets[?starts_with(Name, '${CLUSTER_NAME}-models-')].Name | [0]" \
  --output text)
echo "Model bucket: ${MODEL_BUCKET}"
Recherchez l'ARN de la politique IAM :
POLICY_ARN=$(aws iam list-policies \
  --scope Local \
  --query "Policies[?PolicyName=='${CLUSTER_NAME}-model-storage-policy'].Arn" \
  --output text)
echo "Policy ARN: ${POLICY_ARN}"
Supprimez le bucket du modèle S3 et tous ses objets :
aws s3 rb s3://${MODEL_BUCKET} --force
Supprimez l'association EKS Pod Identity :
eksctl delete podidentityassociation \
  --cluster ${CLUSTER_NAME} \
  --namespace default \
  --service-account-name model-storage-sa \
  --region ${AWS_REGION}
Supprimez la politique IAM :
aws iam delete-policy --policy-arn ${POLICY_ARN}
Supprimez les Kubernetes ServiceAccount :
kubectl delete serviceaccount model-storage-sa
kubectl delete nodepool gpu-inf --ignore-not-found
kubectl delete nodeclass gpu-inf --ignore-not-found
kubectl delete ec2nodeclass gpu-inf --ignore-not-found
eksctl delete cluster --name=$CLUSTER_NAME --region=$AWS_REGION
