Ayude a mejorar esta página
Para contribuir a esta guía del usuario, elija el enlace Edit this page on GitHub que se encuentra en el panel derecho de cada página.
Modelos de carga y servicio en Amazon EKS
sugerencia
Regístrese
Los pasos de esta sección implementan un modelo de lenguaje de gran tamaño (LLM) en Amazon EKS, lo sirven con vLLM e interactúan con el punto de conexión de inferencia.
En este tutorial se utilizan las siguientes herramientas:
-
vLLM:
un motor de inferencia de alto rendimiento optimizado para el servicio de LLM y la administración de la memoria de la GPU. -
Run:ai Model Streamer:
transmite los pesos de los modelos directamente desde Amazon S3 a la memoria de la GPU, lo que reduce el tiempo de carga de minutos a segundos. -
Open WebUI:
un frontend de chat autoalojado que se conecta a la API compatible con OpenAI del vLLM.
En esta sección se utiliza el modelo Ministral-3-8B-Instruct-2512
importante
Utilice el clúster que ha creado en la sección Configuración del clúster de Amazon EKS para cargas de trabajo de IA y ML. Las instrucciones de este tutorial funcionan tanto para el modo automático de EKS como para Karpenter autoadministrado.
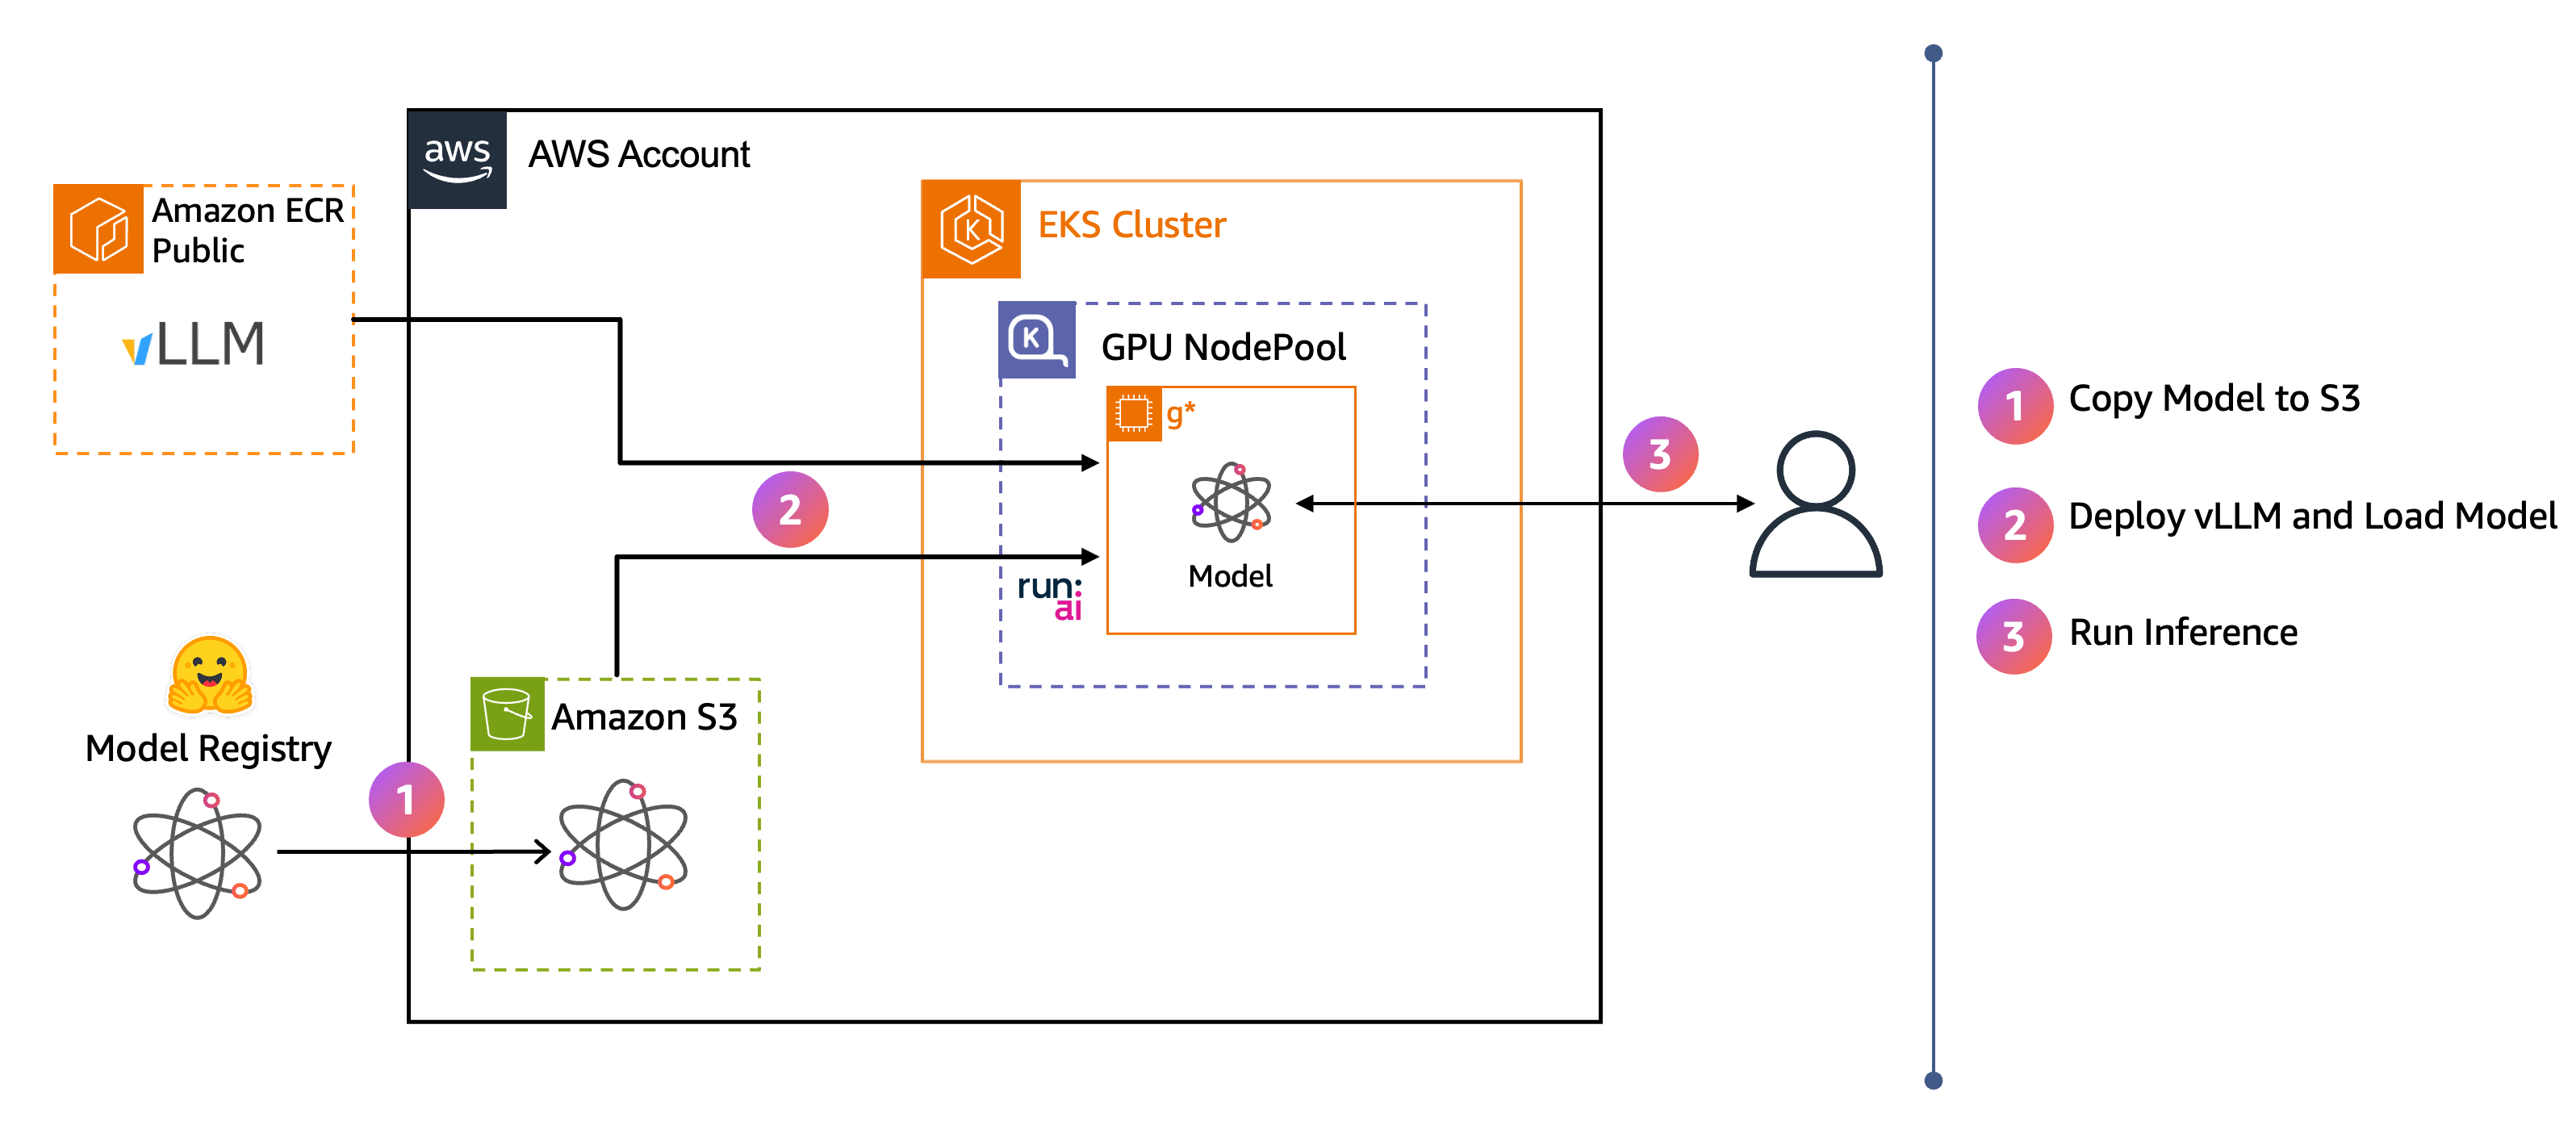
En el siguiente diagrama de arquitectura se muestra el flujo integral:
-
Los pesos de los modelos se descargan de Hugging Face en Amazon S3.
-
vLLM transmite el modelo directamente desde S3 a la memoria de la GPU mediante Run:ai Model Streamer.
-
Los usuarios envían solicitudes de inferencia al punto de conexión de vLLM.
Al completar estos pasos, dispondrá de un punto de conexión de inferencia de vLLM que podrá utilizar para interactuar con un modelo de Ministral a través de una aplicación de frontend de chat.
Requisitos previos
Complete los pasos de la sección de configuración del clúster.
Si ha abierto un terminal nuevo, configure el nombre y la región del clúster que utilizó en la sección Configuración del clúster mediante la CLI:
export CLUSTER_NAME=ai-eks-docs
export AWS_REGION=us-east-2
Busque el grupo de pesos de los modelos que creó en el paso Bucket de S3 de pesos de los modelos:
MODEL_BUCKET=$(aws s3api list-buckets \
  --query "Buckets[?starts_with(Name, '${CLUSTER_NAME}-models-')].Name | [0]" \
  --output text)
echo "Model bucket: ${MODEL_BUCKET}"
Paso 1: descarga del modelo desde Hugging Face
En este paso, implementará un trabajo de Kubernetes que descarga el modelo desde Hugging Face y lo cargará en el bucket de S3 que creó en la sección de requisitos previos.
Para descargar el modelo, aplique el siguiente manifiesto de trabajo:
cat << EOF | kubectl apply -f -
apiVersion: batch/v1
kind: Job
metadata:
  name: model-download
  namespace: default
  labels:
    guide: ai-eks-docs
spec:
  backoffLimit: 10
  activeDeadlineSeconds: 3600
  ttlSecondsAfterFinished: 86400
  template:
    spec:
      restartPolicy: Never
      serviceAccountName: model-storage-sa
      containers:
      - name: downloader
        image: python:3.11-slim
        command: ["/bin/bash", "-c"]
        args:
        - |
          set -e
          pip install -q huggingface_hub boto3
          echo "Downloading Ministral-3-8B-Instruct-2512 from Hugging Face..."
          python3 -c "from huggingface_hub import snapshot_download; snapshot_download('mistralai/Ministral-3-8B-Instruct-2512', local_dir='/tmp/mistral', allow_patterns=['*.json', '*.txt', '*.md', 'consolidated.safetensors'], ignore_patterns=['model-*.safetensors', 'model.safetensors.index.json'])"
          echo "Uploading to S3 bucket: \${MODEL_BUCKET}"
          python3 << 'PYTHON'
          import boto3
          import os
          from pathlib import Path

          s3 = boto3.client('s3')
          bucket = os.environ.get('MODEL_BUCKET')
          local_dir = Path("/tmp/mistral")

          for file_path in local_dir.rglob("*"):
              if file_path.is_file():
                  if '.cache' in file_path.parts:
                      continue
                  s3_key = f"Ministral-3-8B-Instruct-2512/{file_path.relative_to(local_dir)}"
                  print(f"Uploading {file_path.name}...")
                  s3.upload_file(str(file_path), bucket, s3_key)
          print("Upload complete!")
          PYTHON
        env:
        - name: MODEL_BUCKET
          value: "${MODEL_BUCKET}"
        - name: HF_HUB_DISABLE_XET
          value: "1"
        resources:
          requests:
            memory: "2Gi"
            cpu: "1"
          limits:
            memory: "4Gi"
            cpu: "2"
EOF
Espere a que el trabajo finalice. Los pesos de los modelos (consolidated.safetensors) son de aproximadamente 10,4 GB y este paso suele tardar de 3 a 5 minutos.
kubectl wait --for=condition=complete job/model-download --timeout=600s
Resultado previsto:
job.batch/model-download condition met
Verifique que los pesos de los modelo se cargaron en S3:
aws s3 ls s3://$(kubectl get job model-download -o jsonpath='{.spec.template.spec.containers[0].env[?(@.name=="MODEL_BUCKET")].value}')/Ministral-3-8B-Instruct-2512/ --recursive
Resultado previsto:
2026-05-18 10:29:53      20311 Ministral-3-8B-Instruct-2512/README.md
2026-05-18 10:29:53       2361 Ministral-3-8B-Instruct-2512/SYSTEM_PROMPT.txt
2026-05-18 10:29:53       1903 Ministral-3-8B-Instruct-2512/config.json
2026-05-18 10:29:54 10420633176 Ministral-3-8B-Instruct-2512/consolidated.safetensors
2026-05-18 10:29:53        131 Ministral-3-8B-Instruct-2512/generation_config.json
2026-05-18 10:29:53       1185 Ministral-3-8B-Instruct-2512/params.json
2026-05-18 10:29:53        976 Ministral-3-8B-Instruct-2512/processor_config.json
2026-05-18 10:29:53   16753777 Ministral-3-8B-Instruct-2512/tekken.json
2026-05-18 10:29:53   17077402 Ministral-3-8B-Instruct-2512/tokenizer.json
2026-05-18 10:29:53      21168 Ministral-3-8B-Instruct-2512/tokenizer_config.json
El archivo consolidated.safetensors contiene los pesos de los modelos (aproximadamente 10,4 GB). El resto de los archivos son archivos de configuración y tokenizadores que vLLM necesita para servir el modelo.
Paso 2: implementación del contenedor de inferencia
En esta sección, implementará vLLM como una implementación de Kubernetes para servir al modelo que cargó en Amazon S3.
En la sección se utilizan Contenedores de aprendizaje profundo de AWS
Esta implementación usa el siguiente DLC de AWS para vLLM 0.21.0
public.ecr.aws/deep-learning-containers/vllm:0.21.0-gpu-py312-cu130-ubuntu22.04-ec2-v1.0-soci
La etiqueta de imagen indica que vLLM 0.21.0 es compatible con GPU, Python 3.12, CUDA 13.0 y Ubuntu 22.04, está optimizada para cargas de trabajo basadas en EC2 y está habilitada para SOCI a fin de acelerar el inicio de los contenedores.
Este manifiesto crea una implementación que ejecuta vLLM en un nodo de la GPU y transmite el modelo directamente desde S3 a la memoria de la GPU mediante Run:ai Model Streamer. El manifiesto también crea un servicio ClusterIP que expone el punto de conexión de vLLM en el puerto 8000 para el acceso dentro del clúster.
Aplique el manifiesto:
cat << EOF | kubectl apply -f -
apiVersion: apps/v1
kind: Deployment
metadata:
  name: vllm-inference-app
  labels:
    guide: ai-eks-docs
spec:
  replicas: 1
  selector:
    matchLabels:
      app: vllm-inference-app
  template:
    metadata:
      labels:
        app: vllm-inference-app
        guide: ai-eks-docs
    spec:
      serviceAccountName: model-storage-sa
      tolerations:
      - key: nvidia.com/gpu
        operator: Exists
        effect: NoSchedule
      nodeSelector:
        karpenter.sh/nodepool: gpu-inf
      containers:
      - name: vllm-inference
        image: public.ecr.aws/deep-learning-containers/vllm:0.21.0-gpu-py312-cu130-ubuntu22.04-ec2-v1.0-soci
        ports:
        - containerPort: 8000
        args:
        - "--model=s3://${MODEL_BUCKET}/Ministral-3-8B-Instruct-2512/"
        - "--host=0.0.0.0"
        - "--port=8000"
        - "--tensor-parallel-size=1"
        - "--gpu-memory-utilization=0.9"
        - "--max-model-len=8192"
        - "--max-num-seqs=1"
        - "--load-format=runai_streamer"
        - "--enforce-eager"
        - "--tokenizer_mode=mistral"
        - "--config_format=mistral"
        - "--enable-auto-tool-choice"
        - "--tool-call-parser=mistral"
        resources:
          limits:
            nvidia.com/gpu: 1
          requests:
            memory: "40Gi"
            cpu: "8"
---
apiVersion: v1
kind: Service
metadata:
  name: vllm-inference-svc
  namespace: default
  labels:
    app: vllm-inference-app
spec:
  selector:
    app: vllm-inference-app
  ports:
  - name: http
    port: 8000
    targetPort: 8000
    protocol: TCP
EOF
Compruebe que el estado del pod de vLLM sea Listo:
kubectl get pod -l app=vllm-inference-app -w
Resultado previsto:
NAME                                  READY   STATUS    RESTARTS   AGE
vllm-inference-app-65df5fddc8-5kmjm   1/1     Running   0          86s
La imagen del contenedor puede tardar unos 2 minutos en extraerse y vLLM puede tardar este tiempo en transmitir los pesos de los modelos desde S3 a la memoria de la GPU. Espere a que el pod muestre 1/1 en la columna LISTO antes de continuar.
La combinación de EKS, SOCI y Run:ai Model Streamer permite un inicio rápido del pod. Para comprobar la hora de inicio de cada etapa, consulte los eventos del pod:
kubectl describe pod -l app=vllm-inference-app | grep -A 20 "Events:"
Resultado previsto:
Events:
  Type     Reason            Age   From                   Message
  ----     ------            ----  ----                   -------
  Warning  FailedScheduling  86s   default-scheduler      0/2 nodes are available: 2 node(s) had untolerated taint(s).
  Normal   Nominated         85s   eks-auto-mode/compute  Pod should schedule on: nodeclaim/gpu-inf-kqkq6
  Normal   Scheduled         55s   default-scheduler      Successfully assigned default/vllm-inference-app-d9d54586d-csmd7 to i-04f8792414384d2d3
  Normal   Pulling           52s   kubelet                Pulling image "public.ecr.aws/deep-learning-containers/vllm:0.21.0-gpu-py312-cu130-ubuntu22.04-ec2-v1.0-soci"
  Normal   Pulled            4s    kubelet                Successfully pulled image "public.ecr.aws/deep-learning-containers/vllm:0.21.0-gpu-py312-cu130-ubuntu22.04-ec2-v1.0-soci" in 48.376s (48.376s including waiting). Image size: 8802823997 bytes.
  Normal   Created           4s    kubelet                Created container vllm-inference
  Normal   Started           4s    kubelet                Started container vllm-inference
En este ejemplo, el nodo de la GPU se aprovisionó en 30 segundos y la imagen del contenedor de 8,8 GB se obtuvo en aproximadamente 48 segundos mediante SOCI. La rápida extracción de la imagen reduce los tiempos de inicio en frío en contenedores de inferencia de gran tamaño, lo que permite escalar los pods de GPU de forma dinámica en lugar de aprovisionar en exceso la capacidad de la GPU inactiva.
A continuación, compruebe los registros de vLLM para verificar el tiempo de carga del modelo:
kubectl logs $(kubectl get pod -l app=vllm-inference-app -o jsonpath='{.items[0].metadata.name}') | grep -i 'Model loading took'
Resultado previsto:
INFO 05-18 18:41:49 [gpu_model_runner.py:4959] Model loading took 9.81 GiB memory and 5.023344 seconds
El registro confirma que Run:ai Model Streamer cargó los 10,4 GB de pesos de los modelos directamente desde S3 a la memoria de la GPU en aproximadamente 5 segundos, con un consumo de 9,8 GiB de memoria de la GPU.
El tiempo de descarga de la imagen en este ejemplo se utilizó una instancia g6e.4xlarge, que tiene un ancho de banda de la red sostenido de 20 Gbps. Los tiempos de extracción de imágenes y de carga del modelo variarán en función del resto de tipos de instancias en función del ancho de banda de la red disponible.
Paso 3: ejecución de inferencia
Con la implementación de vLLM en ejecución, valide el punto de conexión de inferencia e implemente un frontend de chat para interactuar con el modelo.
Ejecución de una prueba de validación del modelo
Exponga el punto de conexión de inferencia mediante el reenvío de puertos:
kubectl port-forward svc/vllm-inference-svc 8000:8000
Abra una nueva ventana de terminal y, a continuación, valide que el contenedor de inferencia esté respondiendo:
curl -sI -X GET http://localhost:8000/health
Resultado previsto:
HTTP/1.1 200 OK
date: Fri, 18 May 2026 00:39:23 GMT
server: uvicorn
content-length: 0
Paso 4: supervisión de vLLM
vLLM expone las métricas de Prometheus listas para usar, como la tasa de solicitudes, el rendimiento de los tokens, la latencia integral y el uso de la memoria caché KV de la GPU. En esta sección, utiliza estas métricas con la pila de supervisión que configuró en los pasos de Configuración del clúster y las verá en un panel de Grafana aprovisionado previamente.
importante
Debe completar la subsección Supervisión de la sección Configuración del clúster mediante la CLI antes de continuar. Este paso depende de que se esté instalando kube-prometheus-stack y de que el panel de Grafana de vLLM ya esté aprovisionado en el archivo de valores.
Aplicación de ServiceMonitor de vLLM
Un ServiceMonitor indica a Prometheus dónde raspar las métricas de vLLM.
cat << EOF | kubectl apply -f -
apiVersion: monitoring.coreos.com/v1
kind: ServiceMonitor
metadata:
  name: vllm-inference-app
  namespace: default
  labels:
    release: kube-prometheus-stack
spec:
  selector:
    matchLabels:
      app: vllm-inference-app
  endpoints:
  - port: http
    path: /metrics
    interval: 15s
EOF
Verifique que se haya creado correctamente ServiceMonitor:
kubectl get servicemonitor vllm-inference-app
Resultado previsto:
NAME                  AGE
vllm-inference-app    5s
Para llenar el panel con métricas, genere tráfico de inferencia a partir del punto de conexión de vLLM que ya ha expuesto mediante el reenvío de puertos en el paso de validación.
Detecte el nombre del modelo servido:
MODEL_NAME=$(curl -s http://localhost:8000/v1/models | jq -r '.data[0].id')
echo "Using model: $MODEL_NAME"
Envíe 50 solicitudes de finalización de chat en paralelo:
for i in $(seq 1 50); do
  curl -s -X POST http://localhost:8000/v1/chat/completions \
    -H "Content-Type: application/json" \
    -d "{\"model\": \"$MODEL_NAME\", \"messages\": [{\"role\": \"user\", \"content\": \"Write a short poem about Kubernetes.\"}], \"max_tokens\": 128}" \
    > /dev/null &
done
wait
Mientras el tráfico fluya (o inmediatamente después), compruebe las métricas de rendimiento de los tokens directamente desde el punto de conexión /metrics de vLLM:
curl -s http://localhost:8000/metrics | grep -E '^vllm:(prompt_tokens_total|generation_tokens_total|avg_generation_throughput_toks_per_s|avg_prompt_throughput_toks_per_s)' | head
Las métricas vllm:prompt_tokens_total y vllm:generation_tokens_total aumentan monótonamente los contadores de los tokens de entrada y salida servidos. Las métricas vllm:avg_prompt_throughput_toks_per_s y vllm:avg_generation_throughput_toks_per_s son indicadores de rendimiento del promedio acumulativo. Estas mismas métricas alimentan el panel de Grafana que se abre en la siguiente subsección.
Visualización del panel de control de Grafana de vLLM
El archivo de valores de kube-prometheus-stack de la sección Supervisión ya aprovisiona el panel de vLLM (gnetId 25.263)
Para acceder a Grafana, inicie un reenvío de puertos al servicio de Grafana:
kubectl port-forward svc/kube-prometheus-stack-grafana 3000:80 -n monitoring
Abra http://localhost:3000
Panel de Grafana de vLLM

El panel muestra la tasa de solicitudes, el rendimiento de los tokens de petición y generación, los percentiles de latencia y el uso de la caché KV de la GPU para el punto de conexión de inferencia de vLLM.
Paso 5: implementación de una aplicación de chat
En este paso, implementará Open WebUI como frontend de chat para interactuar con el modelo. Open WebUI es una interfaz de IA de código abierto y autoalojada que admite API compatibles con OpenAI y proporciona una interfaz de chat con historial de conversaciones y representación de Markdown. Como vLLM expone una API compatible con OpenAI, Open WebUI se conecta a ella directamente como un backend.
Para implementar la aplicación Open WebUI, aplique el siguiente manifiesto:
cat << 'EOF' | kubectl apply -f -
apiVersion: apps/v1
kind: Deployment
metadata:
  name: open-webui
  namespace: default
  labels:
    app: open-webui
    guide: ai-eks-docs
spec:
  replicas: 1
  selector:
    matchLabels:
      app: open-webui
  template:
    metadata:
      labels:
        app: open-webui
        guide: ai-eks-docs
    spec:
      containers:
      - name: open-webui
        image: ghcr.io/open-webui/open-webui:v0.9.2
        ports:
        - containerPort: 8080
        resources:
          requests:
            cpu: "500m"
            memory: "500Mi"
          limits:
            cpu: "1000m"
            memory: "1Gi"
        env:
        - name: OPENAI_API_BASE_URLS
          value: "http://vllm-inference-svc:8000/v1"
        - name: OPENAI_API_KEY
          value: "dummy"
        - name: WEBUI_AUTH
          value: "False"
        - name: ENABLE_OLLAMA_API
          value: "False"
        - name: ENABLE_EVALUATION_ARENA_MODELS
          value: "False"
        volumeMounts:
        - name: webui-volume
          mountPath: /app/backend/data
      volumes:
      - name: webui-volume
        emptyDir: {}
---
apiVersion: v1
kind: Service
metadata:
  name: open-webui
  namespace: default
  labels:
    app: open-webui
spec:
  type: ClusterIP
  selector:
    app: open-webui
  ports:
  - protocol: TCP
    port: 80
    targetPort: 8080
EOF
Espere a que el pod de Open WebUI esté listo:
kubectl wait --for=condition=ready pod -l app=open-webui --timeout=300s
Resultado previsto:
pod/open-webui-6cbfc9867f-jf9w9 condition met
Para acceder a la aplicación, configure el reenvío de puertos y abra la aplicación en el navegador:
kubectl port-forward svc/open-webui 8080:80 &
sleep 5
echo "Open WebUI: http://localhost:8080"
Abra http://localhost:8080
Aparece la interfaz de chat en la que puede interactuar con el modelo de Ministral.
Cuando termine las pruebas, ejecute kill %1 %2 para detener los procesos de reenvío de puertos en segundo plano (o ejecute jobs para enumerarlos y kill %<jobspec> para cada uno de ellos).

Limpieza
Para eliminar los recursos de carga de trabajo que creó en esta sección, elimine la aplicación Open WebUI, el servidor de inferencias de vLLM y el trabajo de descarga de modelos:
kubectl delete deployment open-webui
kubectl delete service open-webui
kubectl delete deployment vllm-inference-app
kubectl delete service vllm-inference-svc
kubectl delete servicemonitor vllm-inference-app
kubectl delete job model-download
Para obtener instrucciones sobre cómo eliminar recursos de infraestructura, como el clúster, NodePool y el bucket de S3, consulte Limpieza de la configuración del clúster.
