Discover Traces
The Discover Traces page provides a dedicated interface for exploring distributed trace data in your OpenSearch Service observability workspace. You can view RED metrics (rate, error rate, duration) for your services, browse trace spans with faceted filtering, and drill into individual spans and traces to diagnose performance issues. The page also supports correlating traces with related log data.
To access the Traces page
In your observability workspace, expand Discover in the left navigation and choose Traces.

Configuring trace datasets
Before you can explore trace data, you must configure a traces dataset. You can create a dataset automatically or manually.
Automatic dataset creation
When you navigate to the Discover Traces page for the first time and trace data exists in your domain, the page prompts you to create a dataset automatically. Choose Create dataset to accept the default configuration.

Manual dataset creation
To manually create a traces dataset, follow the steps in To create a traces dataset. Manual creation gives you control over the index pattern, timestamp field, and dataset name.
Exploring trace data
The Discover Traces page provides the following components for exploring your trace data.
-
RED metrics – View rate (requests per second), error rate (percentage of failed requests), and duration (latency percentiles) for the selected dataset. These metrics update based on your time filter.
-
Faceted fields – Filter trace spans by service name, operation, status code, and other span attributes. Select values in the faceted fields panel to narrow your results.
-
Span table – Browse individual spans with columns for trace ID, span ID, service name, operation, duration, and status. You can sort by any column and expand rows to see span details.
Viewing a specific span
To view details for a specific span, choose the span row in the span table. A flyout panel opens with the span attributes, resource attributes, and event information.
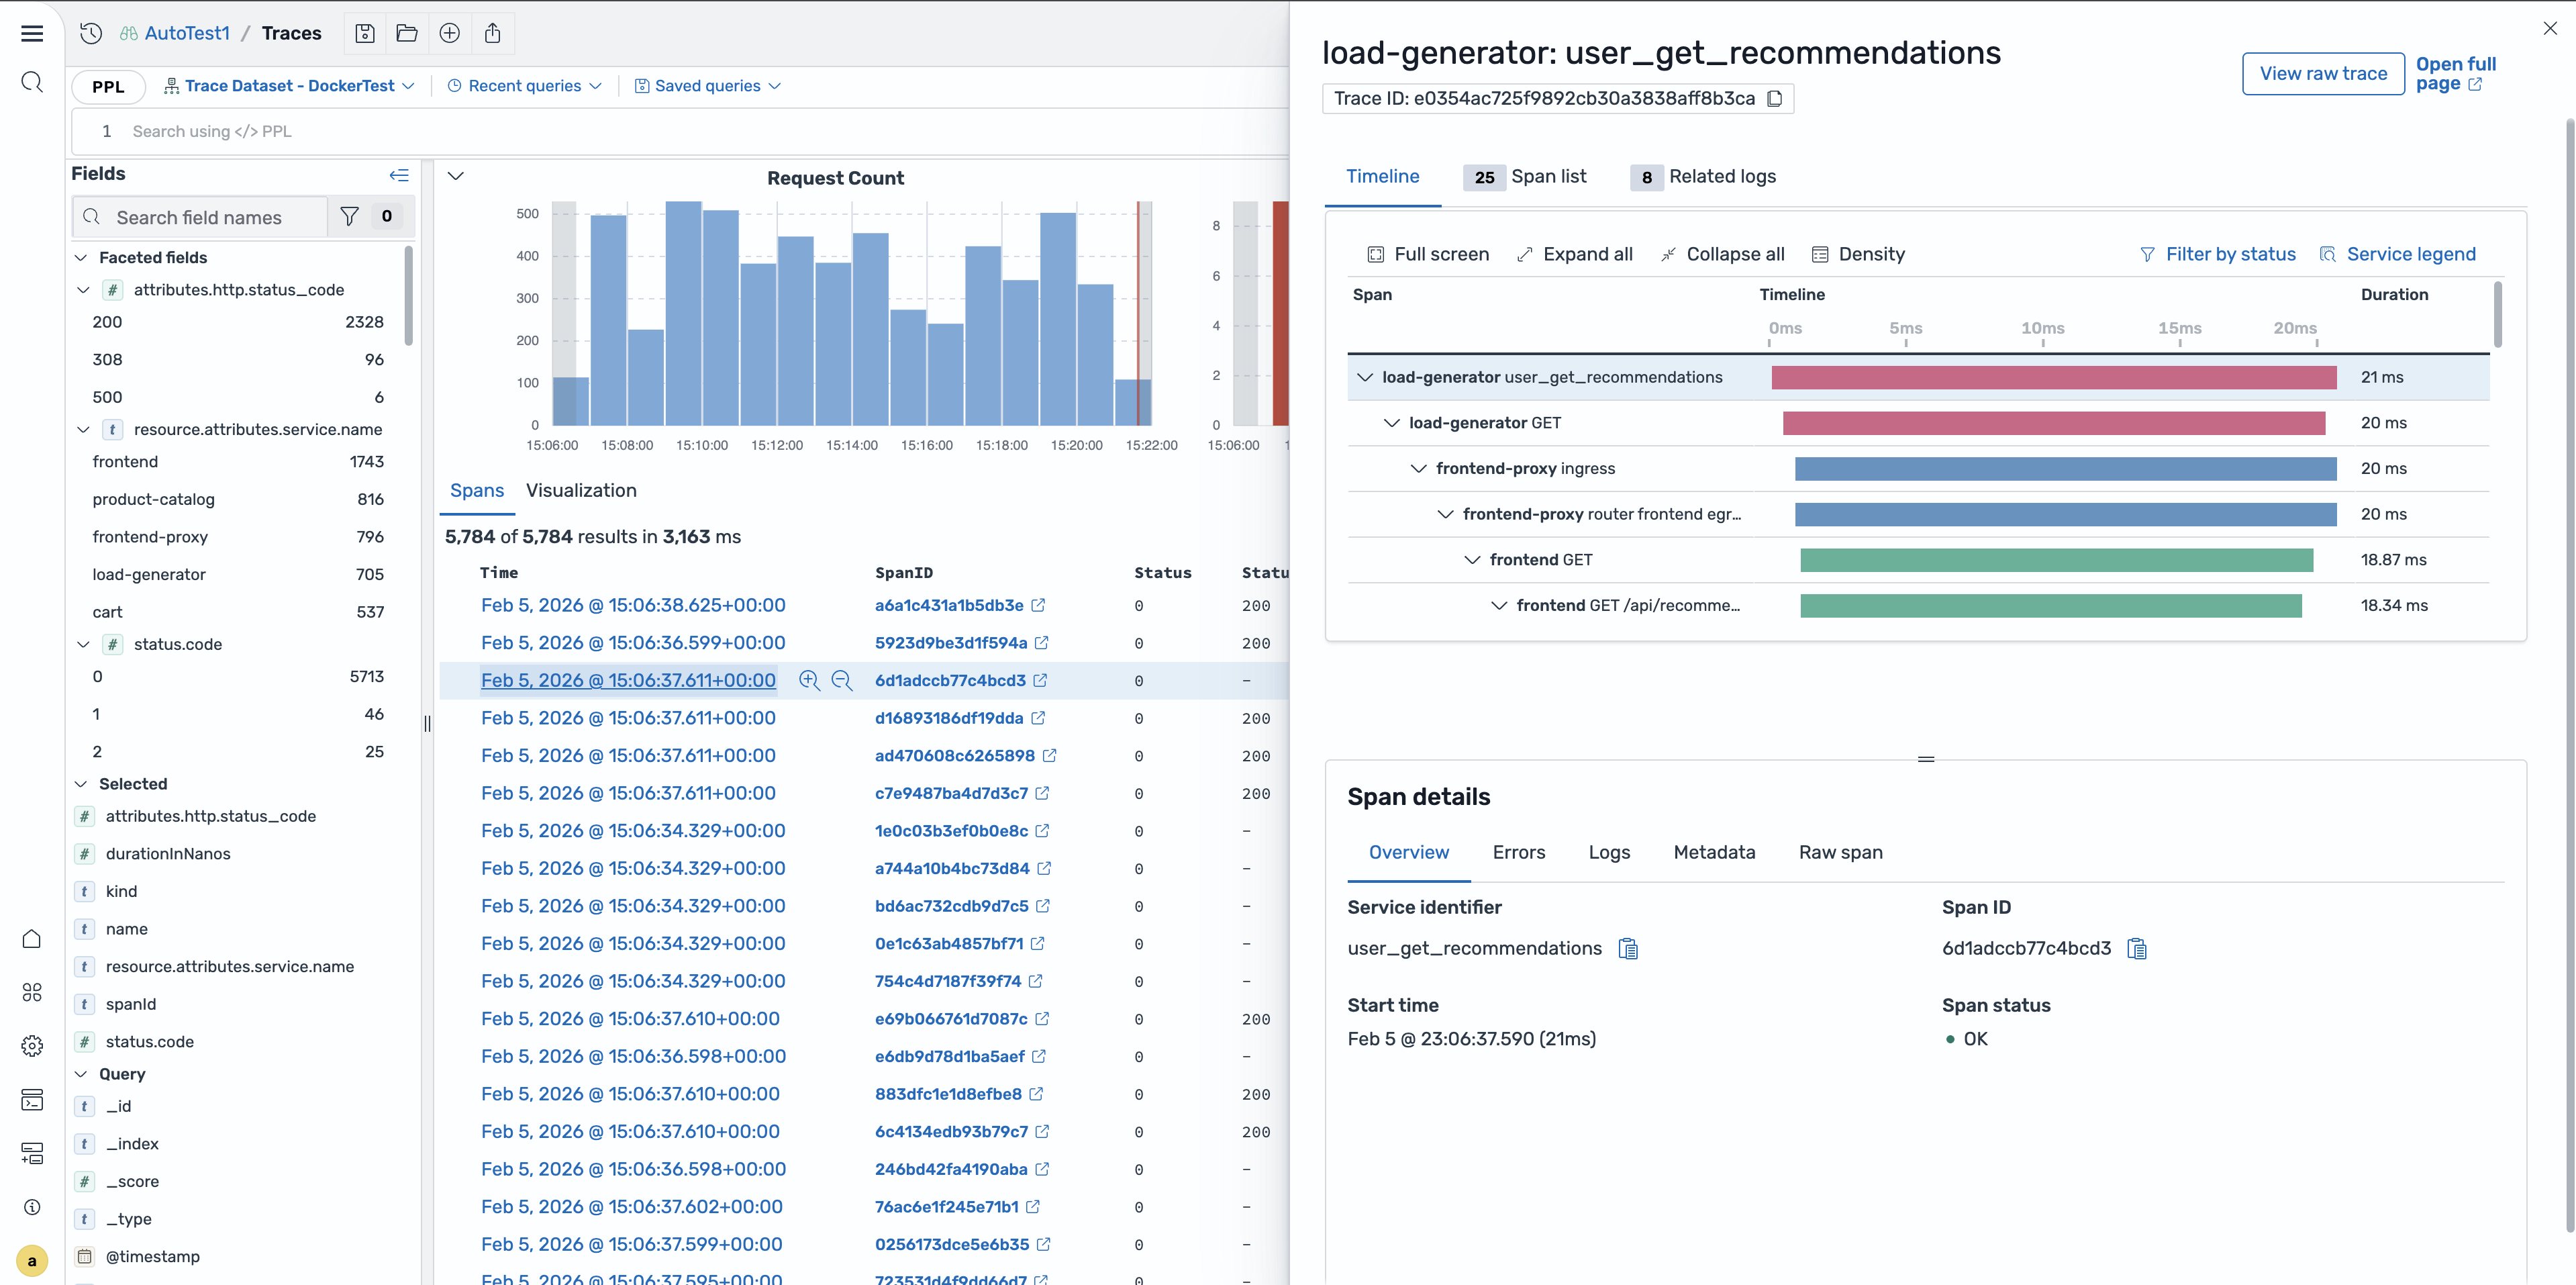
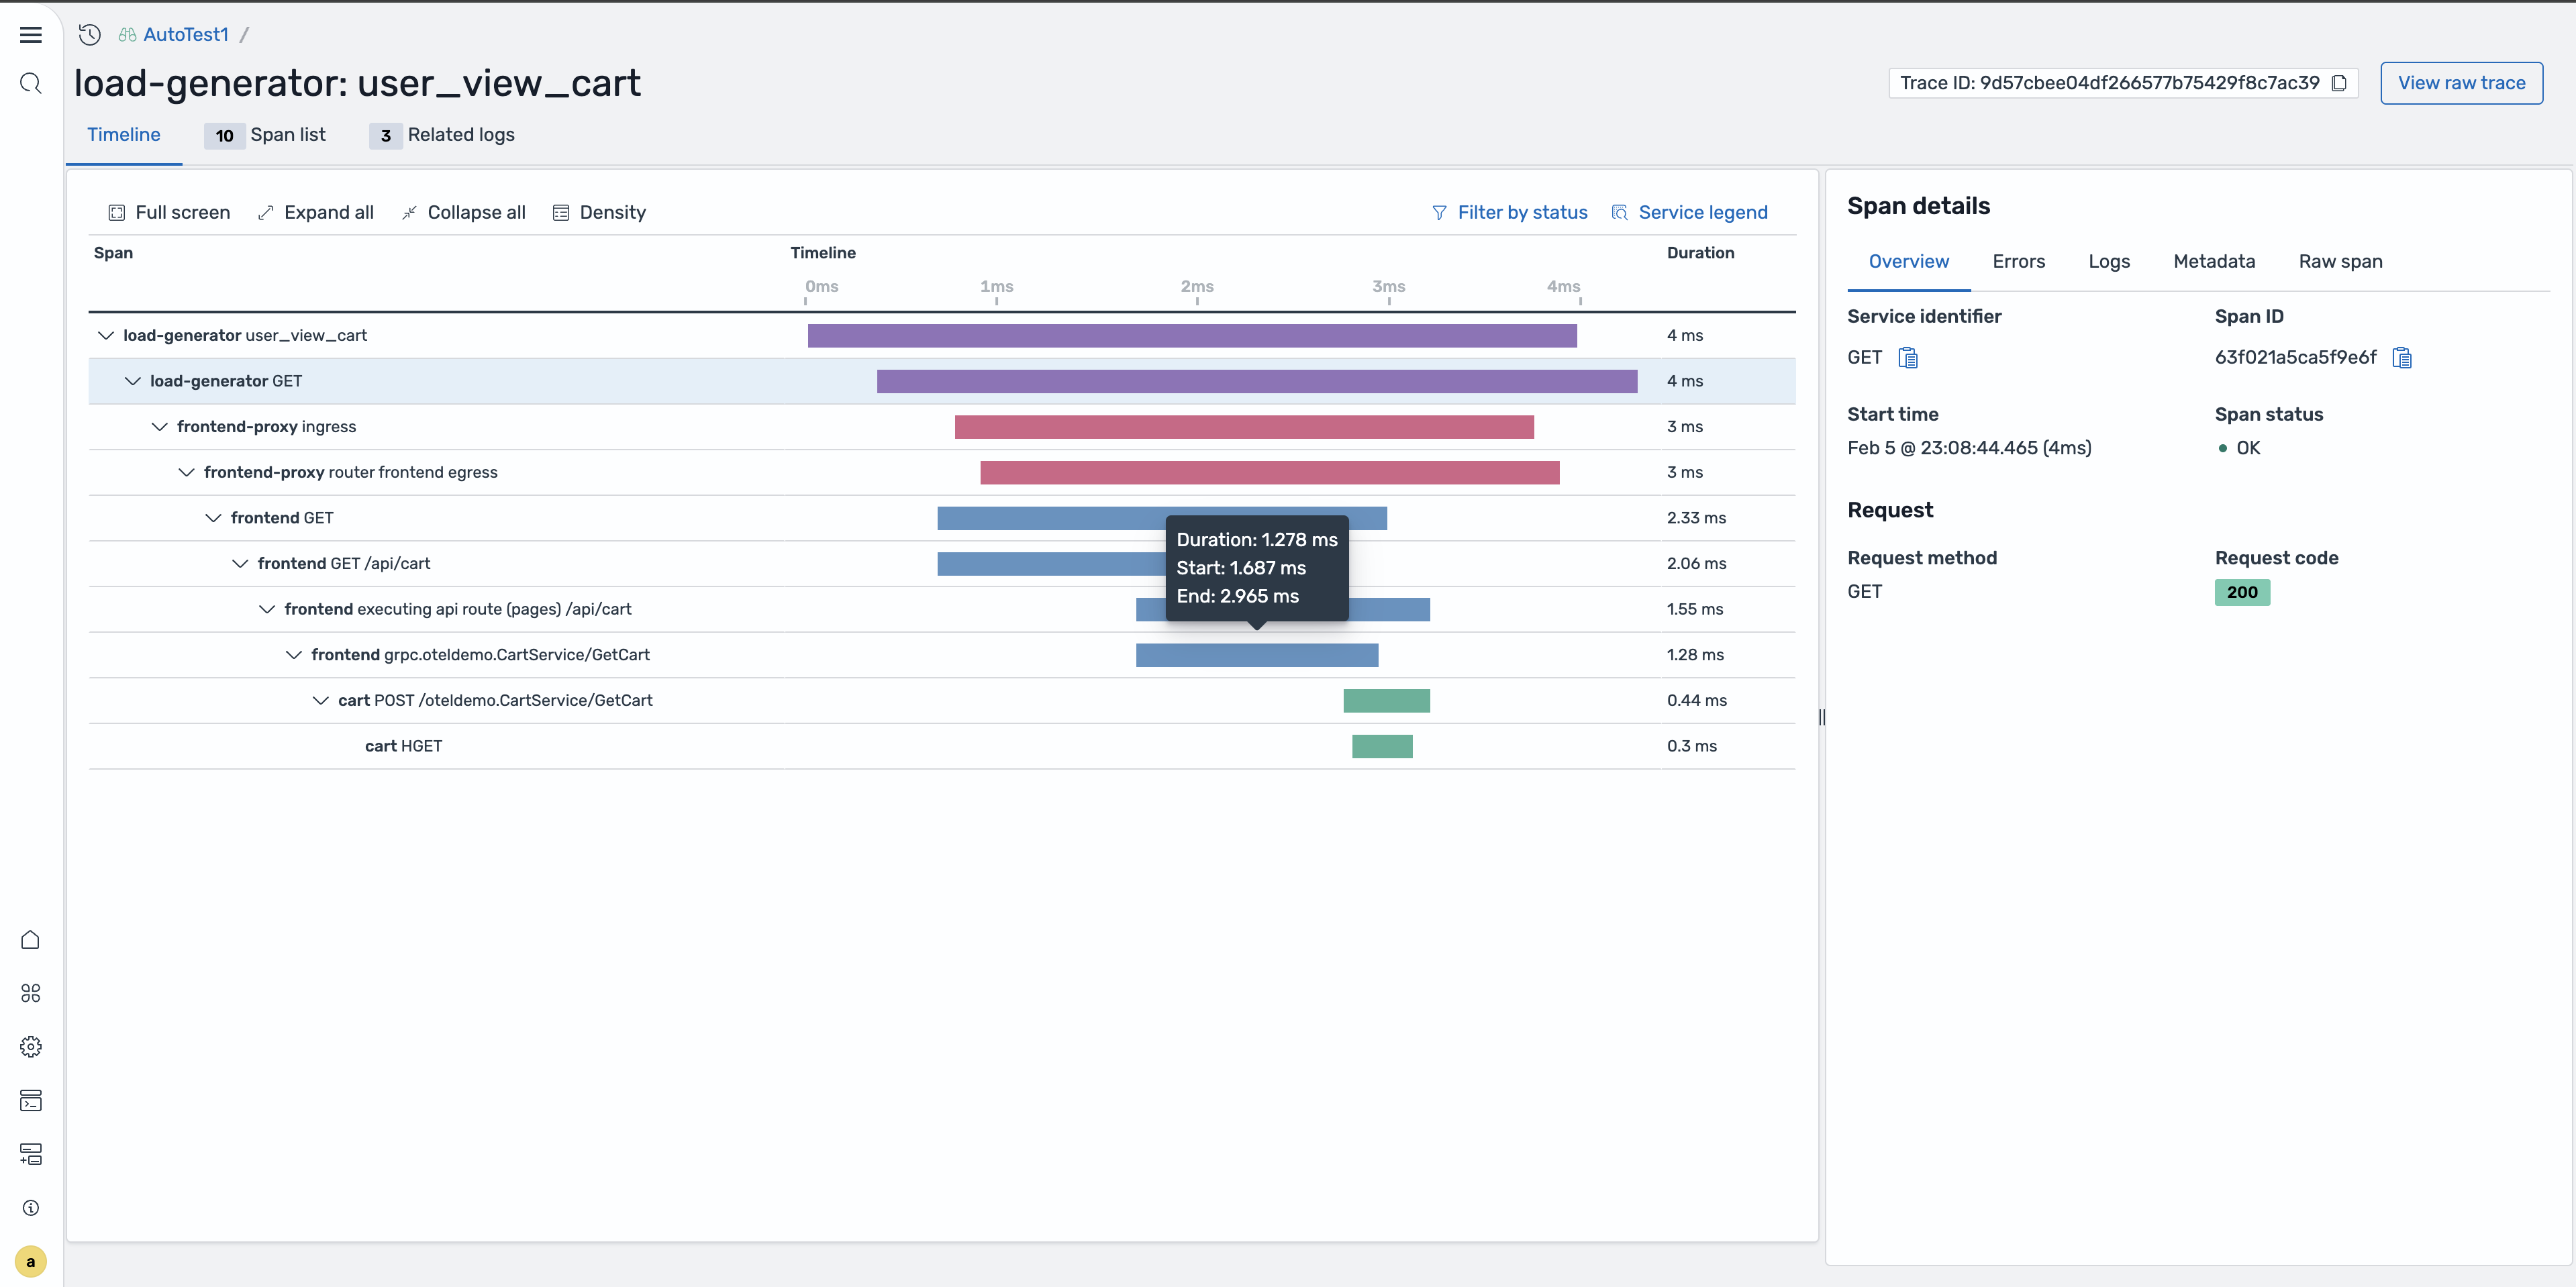
Trace detail page
To view the complete trace, choose the trace ID link in the span table or flyout panel. The trace detail page displays a waterfall chart showing all spans in the trace, their timing relationships, and the overall trace duration. You can expand individual spans to view their attributes and identify bottlenecks.
Correlating traces with logs
When you configure a correlation between a traces dataset and a logs dataset, you can view related log entries directly from the Discover Traces page. For information about creating correlations, see Correlations.
Viewing related logs
In the span details flyout or trace detail page, choose the Related logs tab to view log entries that match the span's trace ID, service name, and time range. This correlation helps you understand what happened in your application during the span execution.

Log redirection with context
You can navigate from a trace span directly to the Discover Logs page with the relevant context preserved. Choose View in Logs from the related logs panel to open the Discover Logs page with the query pre-populated to filter by the span's trace ID and time range.

Querying traces using PPL
You can use PPL to query trace data directly. PPL chains commands using the pipe character to filter, transform, and aggregate span data.
The following example finds the 10 slowest traces:
source = otel-v1-apm-span-*
| where durationInNanos > 5000000000
| fields traceId, serviceName, name, durationInNanos
| sort - durationInNanos
| head 10
The following example counts errors by service:
source = otel-v1-apm-span-*
| where status.code = 2
| stats count() as errorCount by serviceName
| sort - errorCount
The following example finds traces for a specific service:
source = otel-v1-apm-span-*
| where serviceName = 'checkout-service'
| where parentSpanId = ''
| sort - startTime
| head 20
