Agentic Observability with MCP Apps
OpenSearch provides an agentic observability experience with MCP Apps that brings observability workflows into your agentic IDE, with MCP App rendered visualizations that you can verify. This experience augments the webpage-based observability experience on OpenSearch UI (logs, traces, metrics, alerts). Your AI agent can investigate incidents with data stored in OpenSearch domains and collections. With MCP Apps, each MCP tool call returns both a text summary for the agent to reason over and an interactive visualization for you to verify in the same conversation thread.
Topics
MCP App examples
The following examples show how MCP Apps render interactive visualizations inside a compatible agentic IDE while you investigate an incident.
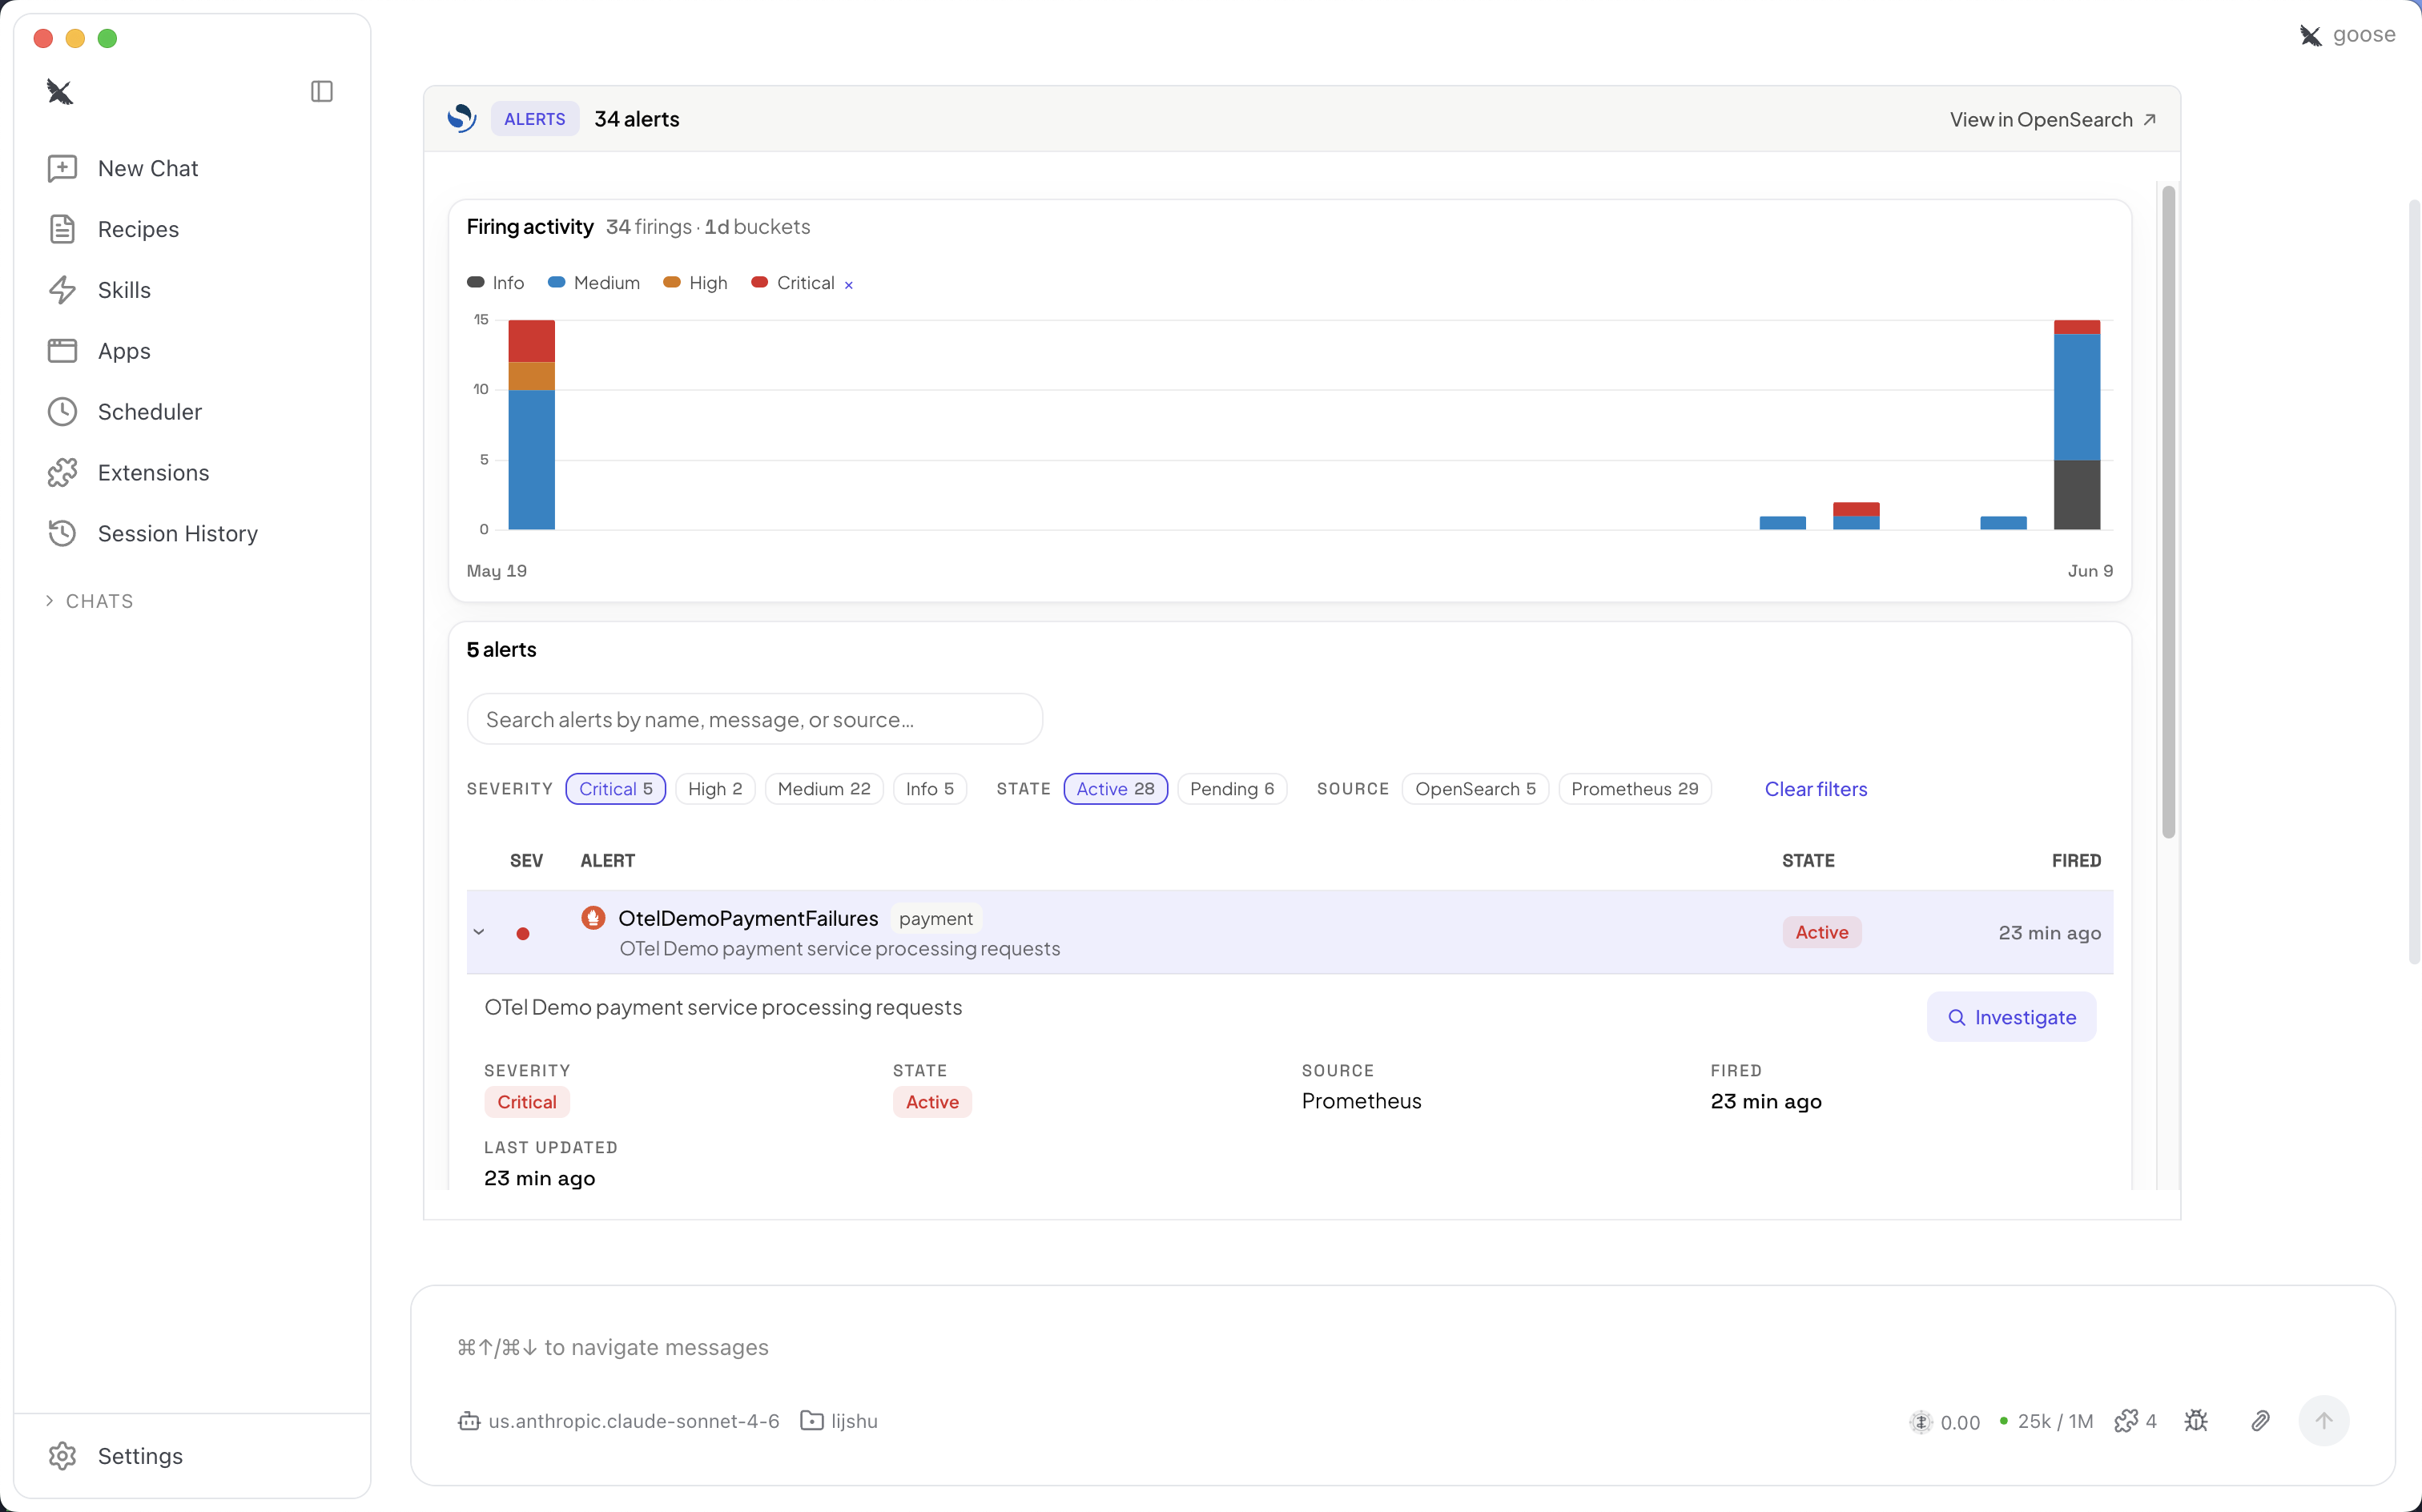
Alerts – View and triage firing alerts across your data sources. The alert view shows firing activity over time, severity breakdowns, and per-alert details, with an option to start an investigation. The following screenshot shows the alerts view with firing activity.
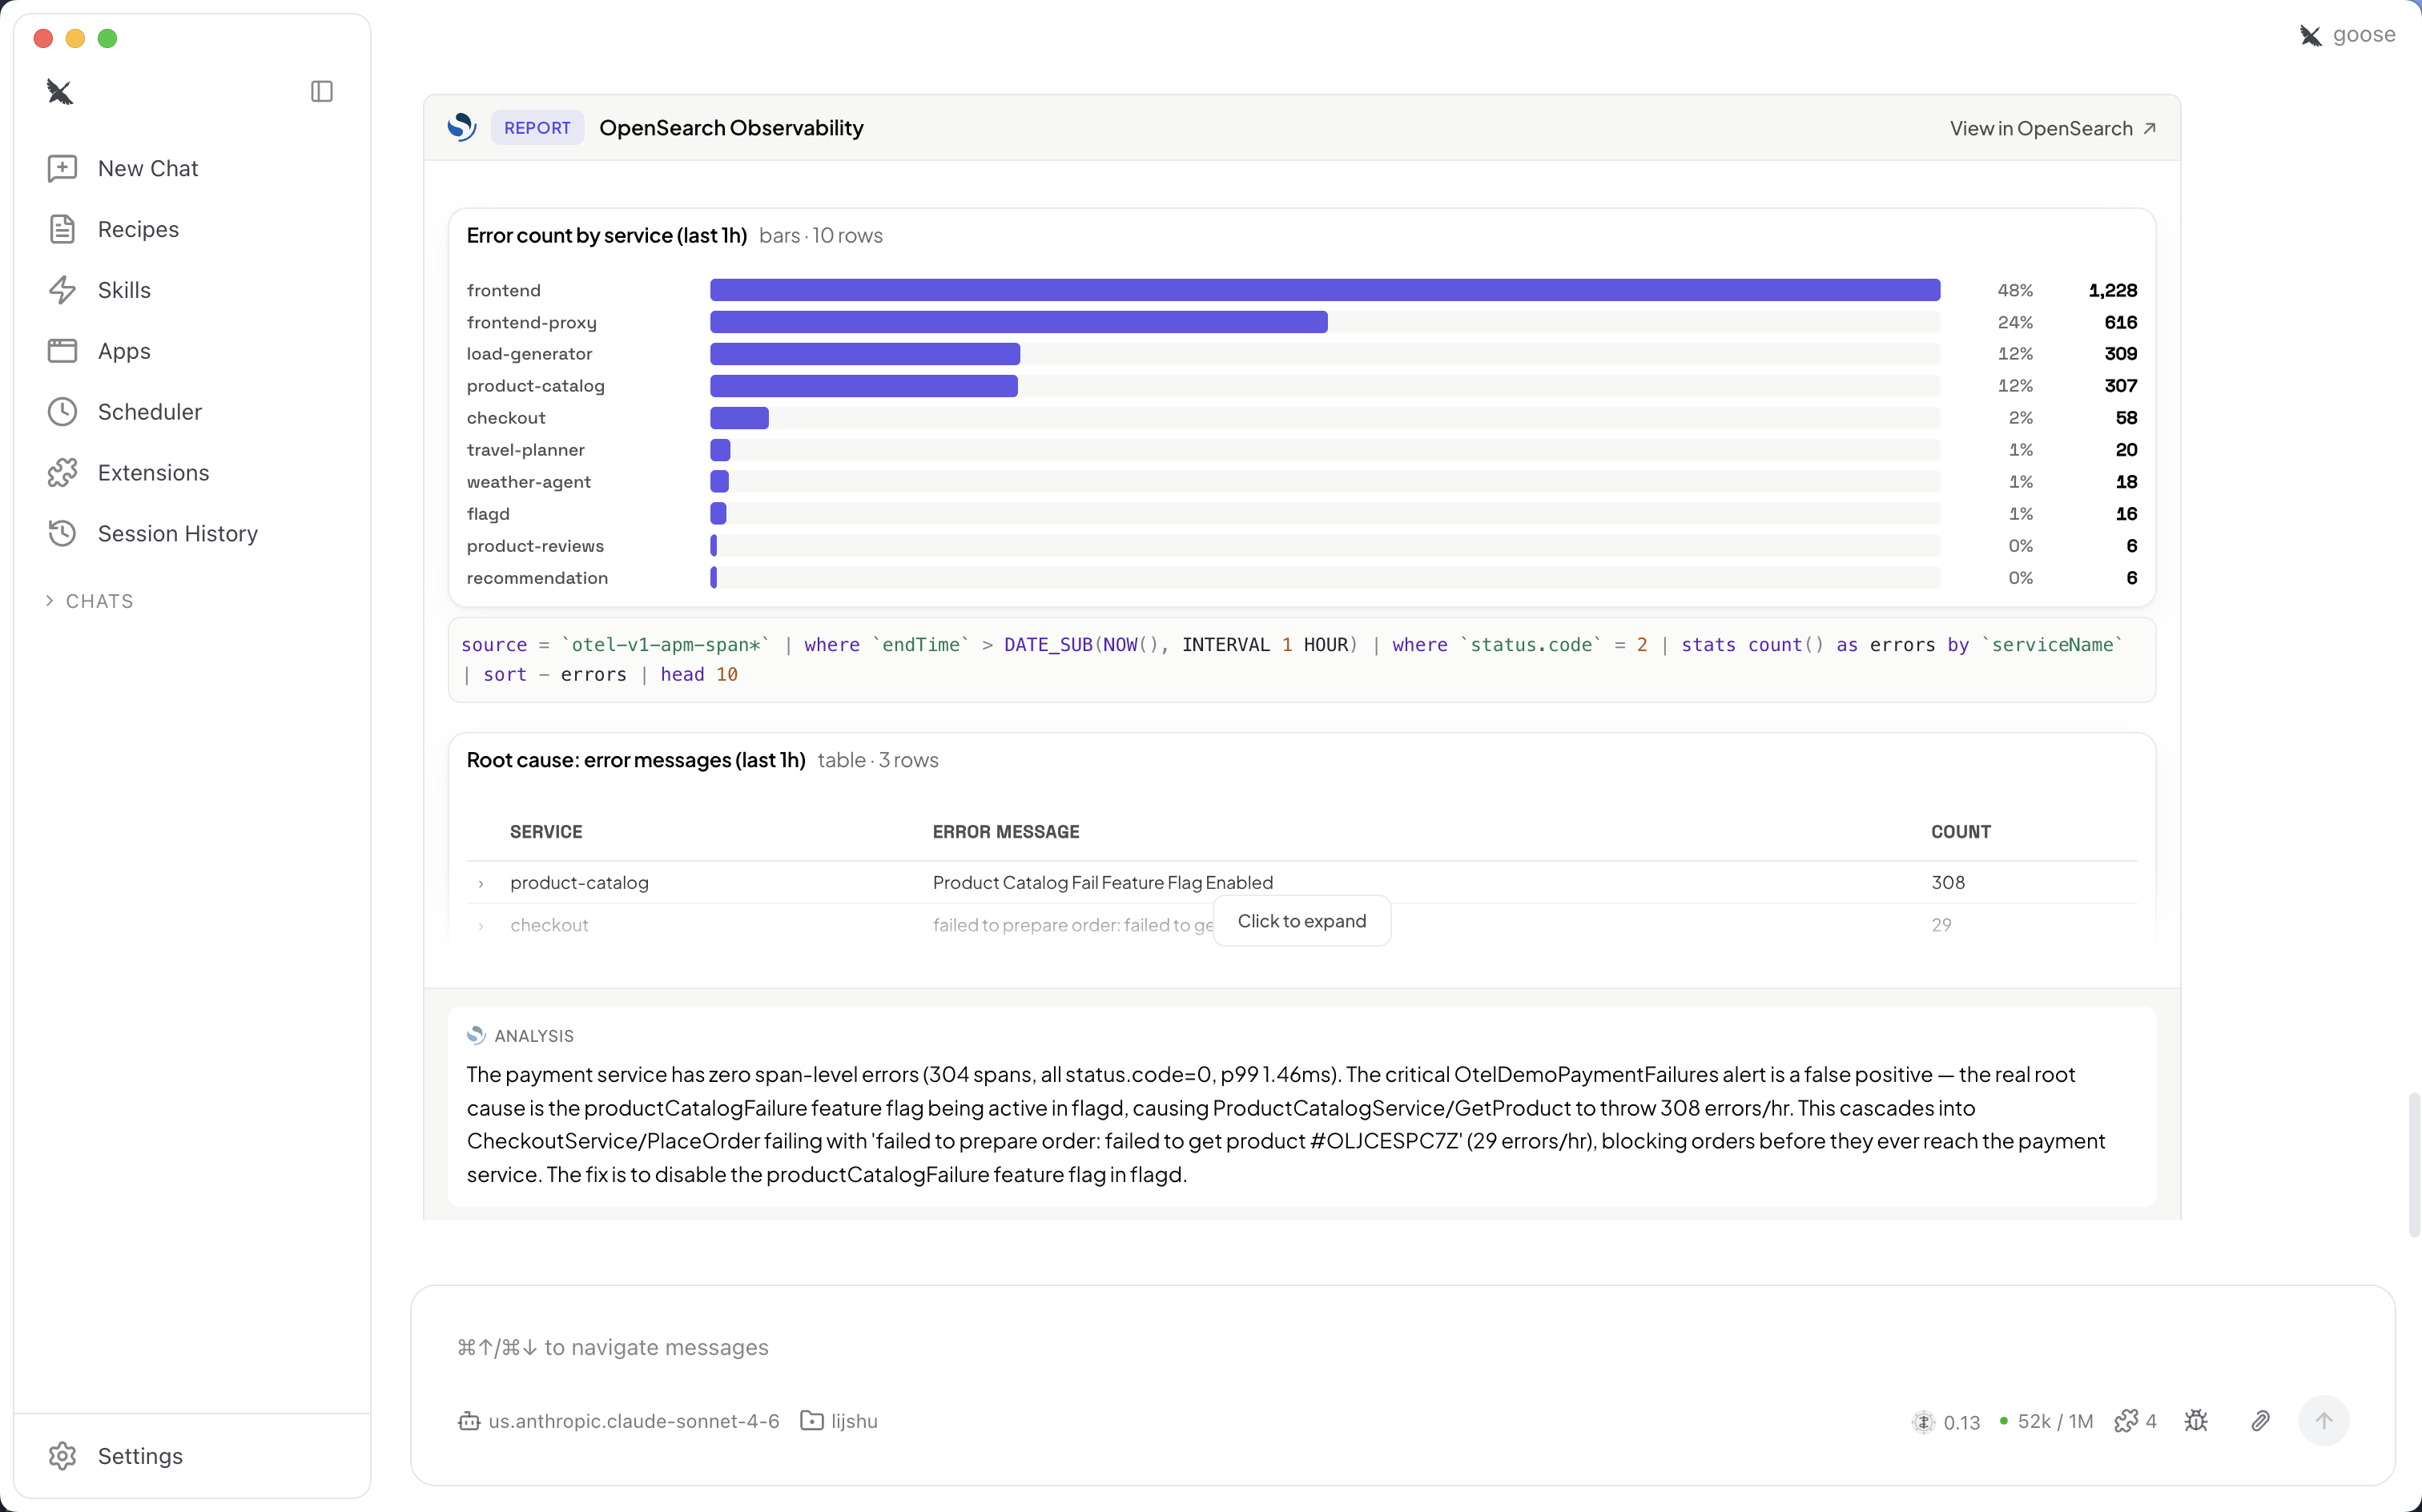
Observability report – Review aggregated results, such as error counts by service, alongside the underlying query and an AI-generated root cause analysis. The following screenshot shows the observability report.
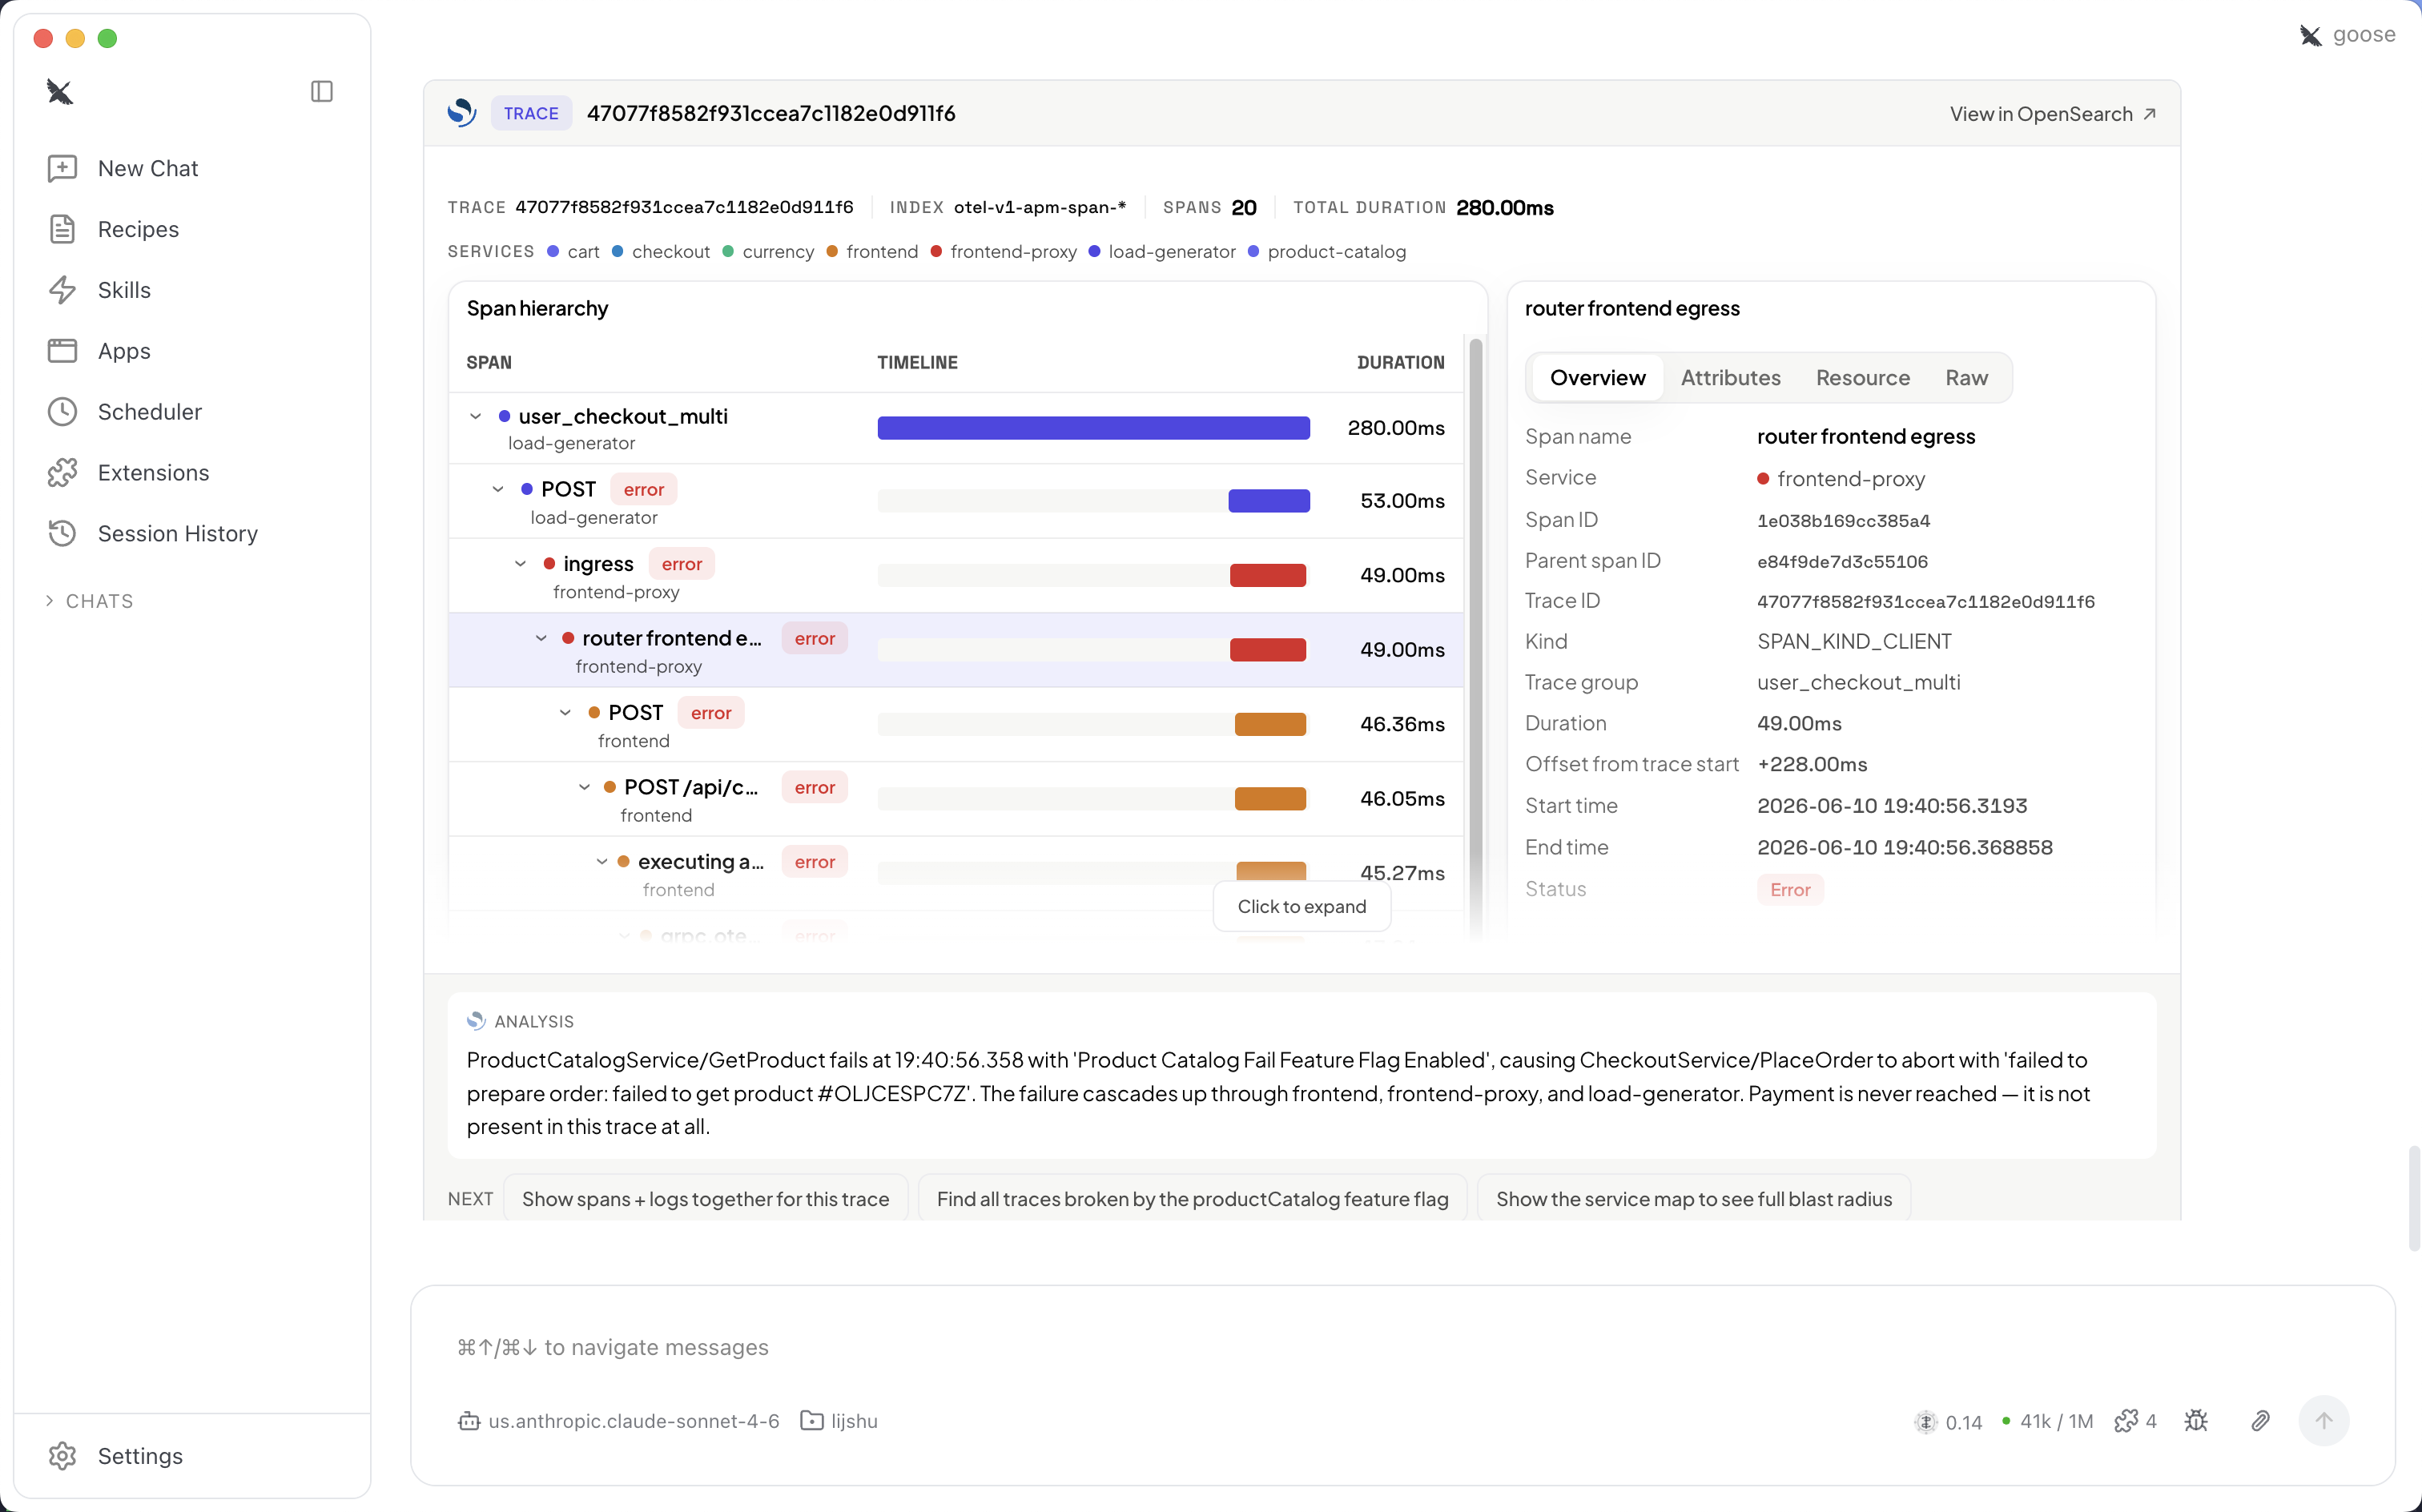
Trace investigation – Explore a distributed trace's span hierarchy and timeline, inspect individual span details, and read an analysis of where a failure originated. The following screenshot shows the trace investigation view.
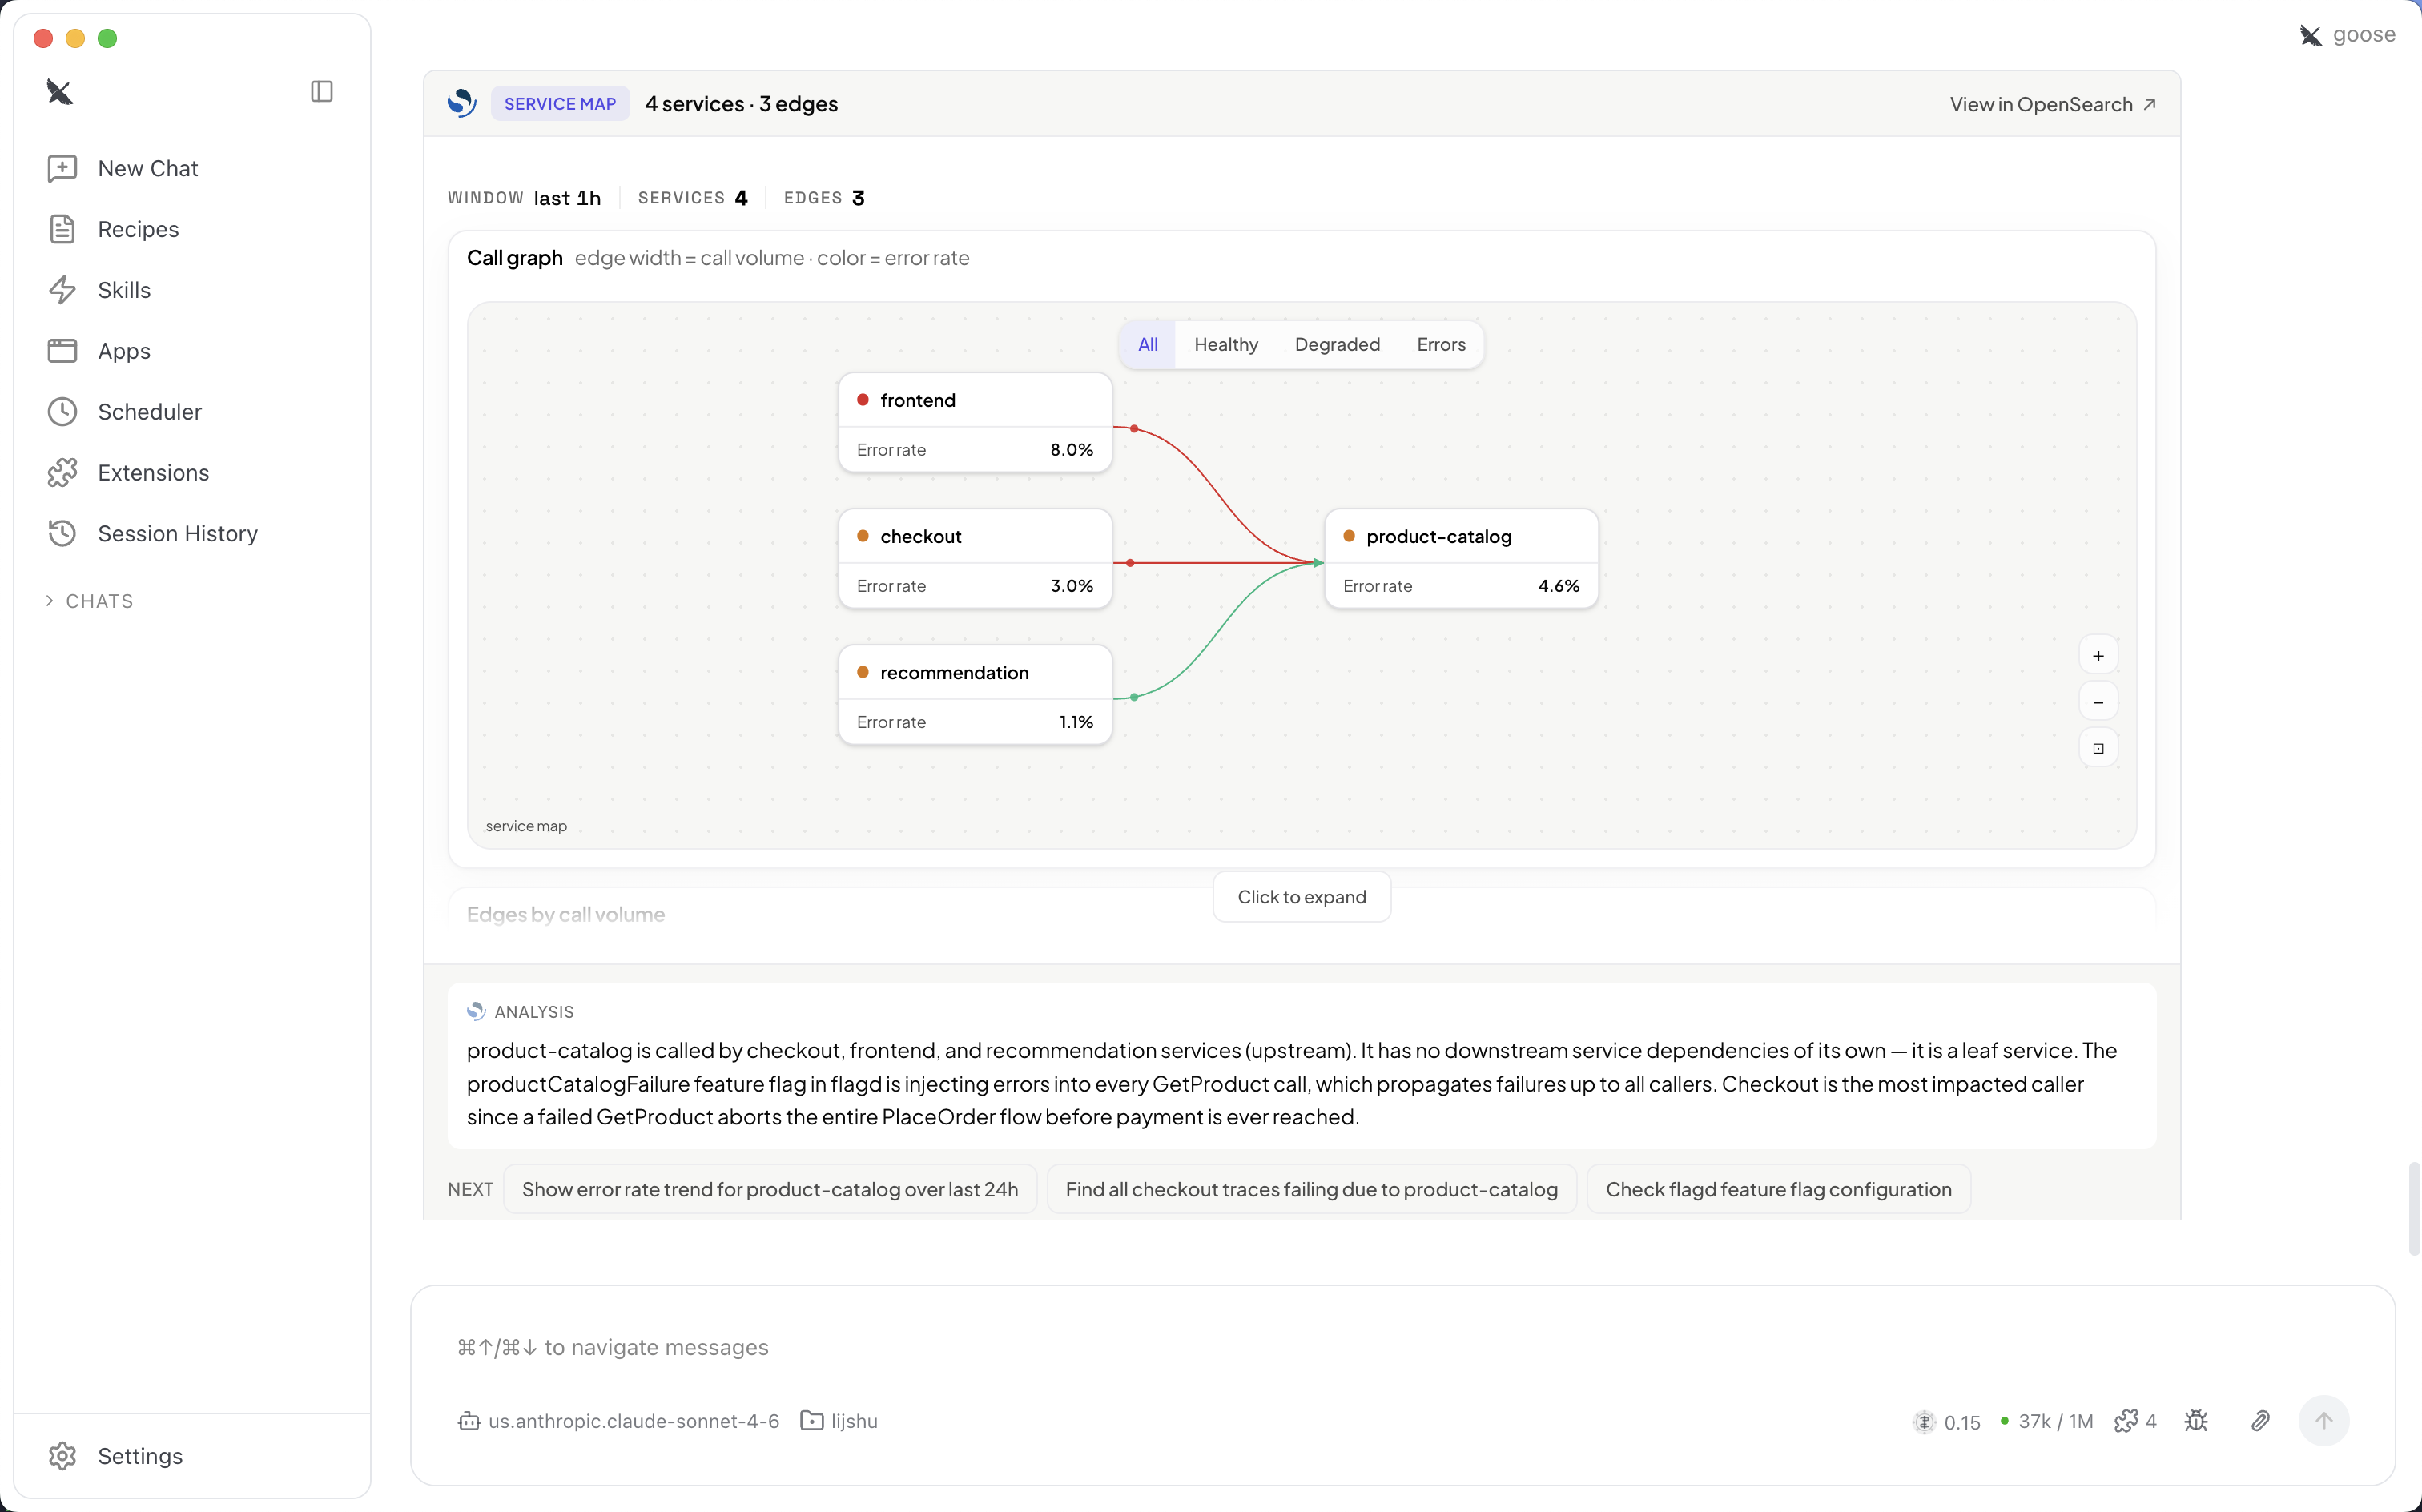
Service map – Visualize service dependencies as a call graph, where edge width reflects call volume and color reflects error rate, to understand the blast radius of an incident. The following diagram shows the service map.
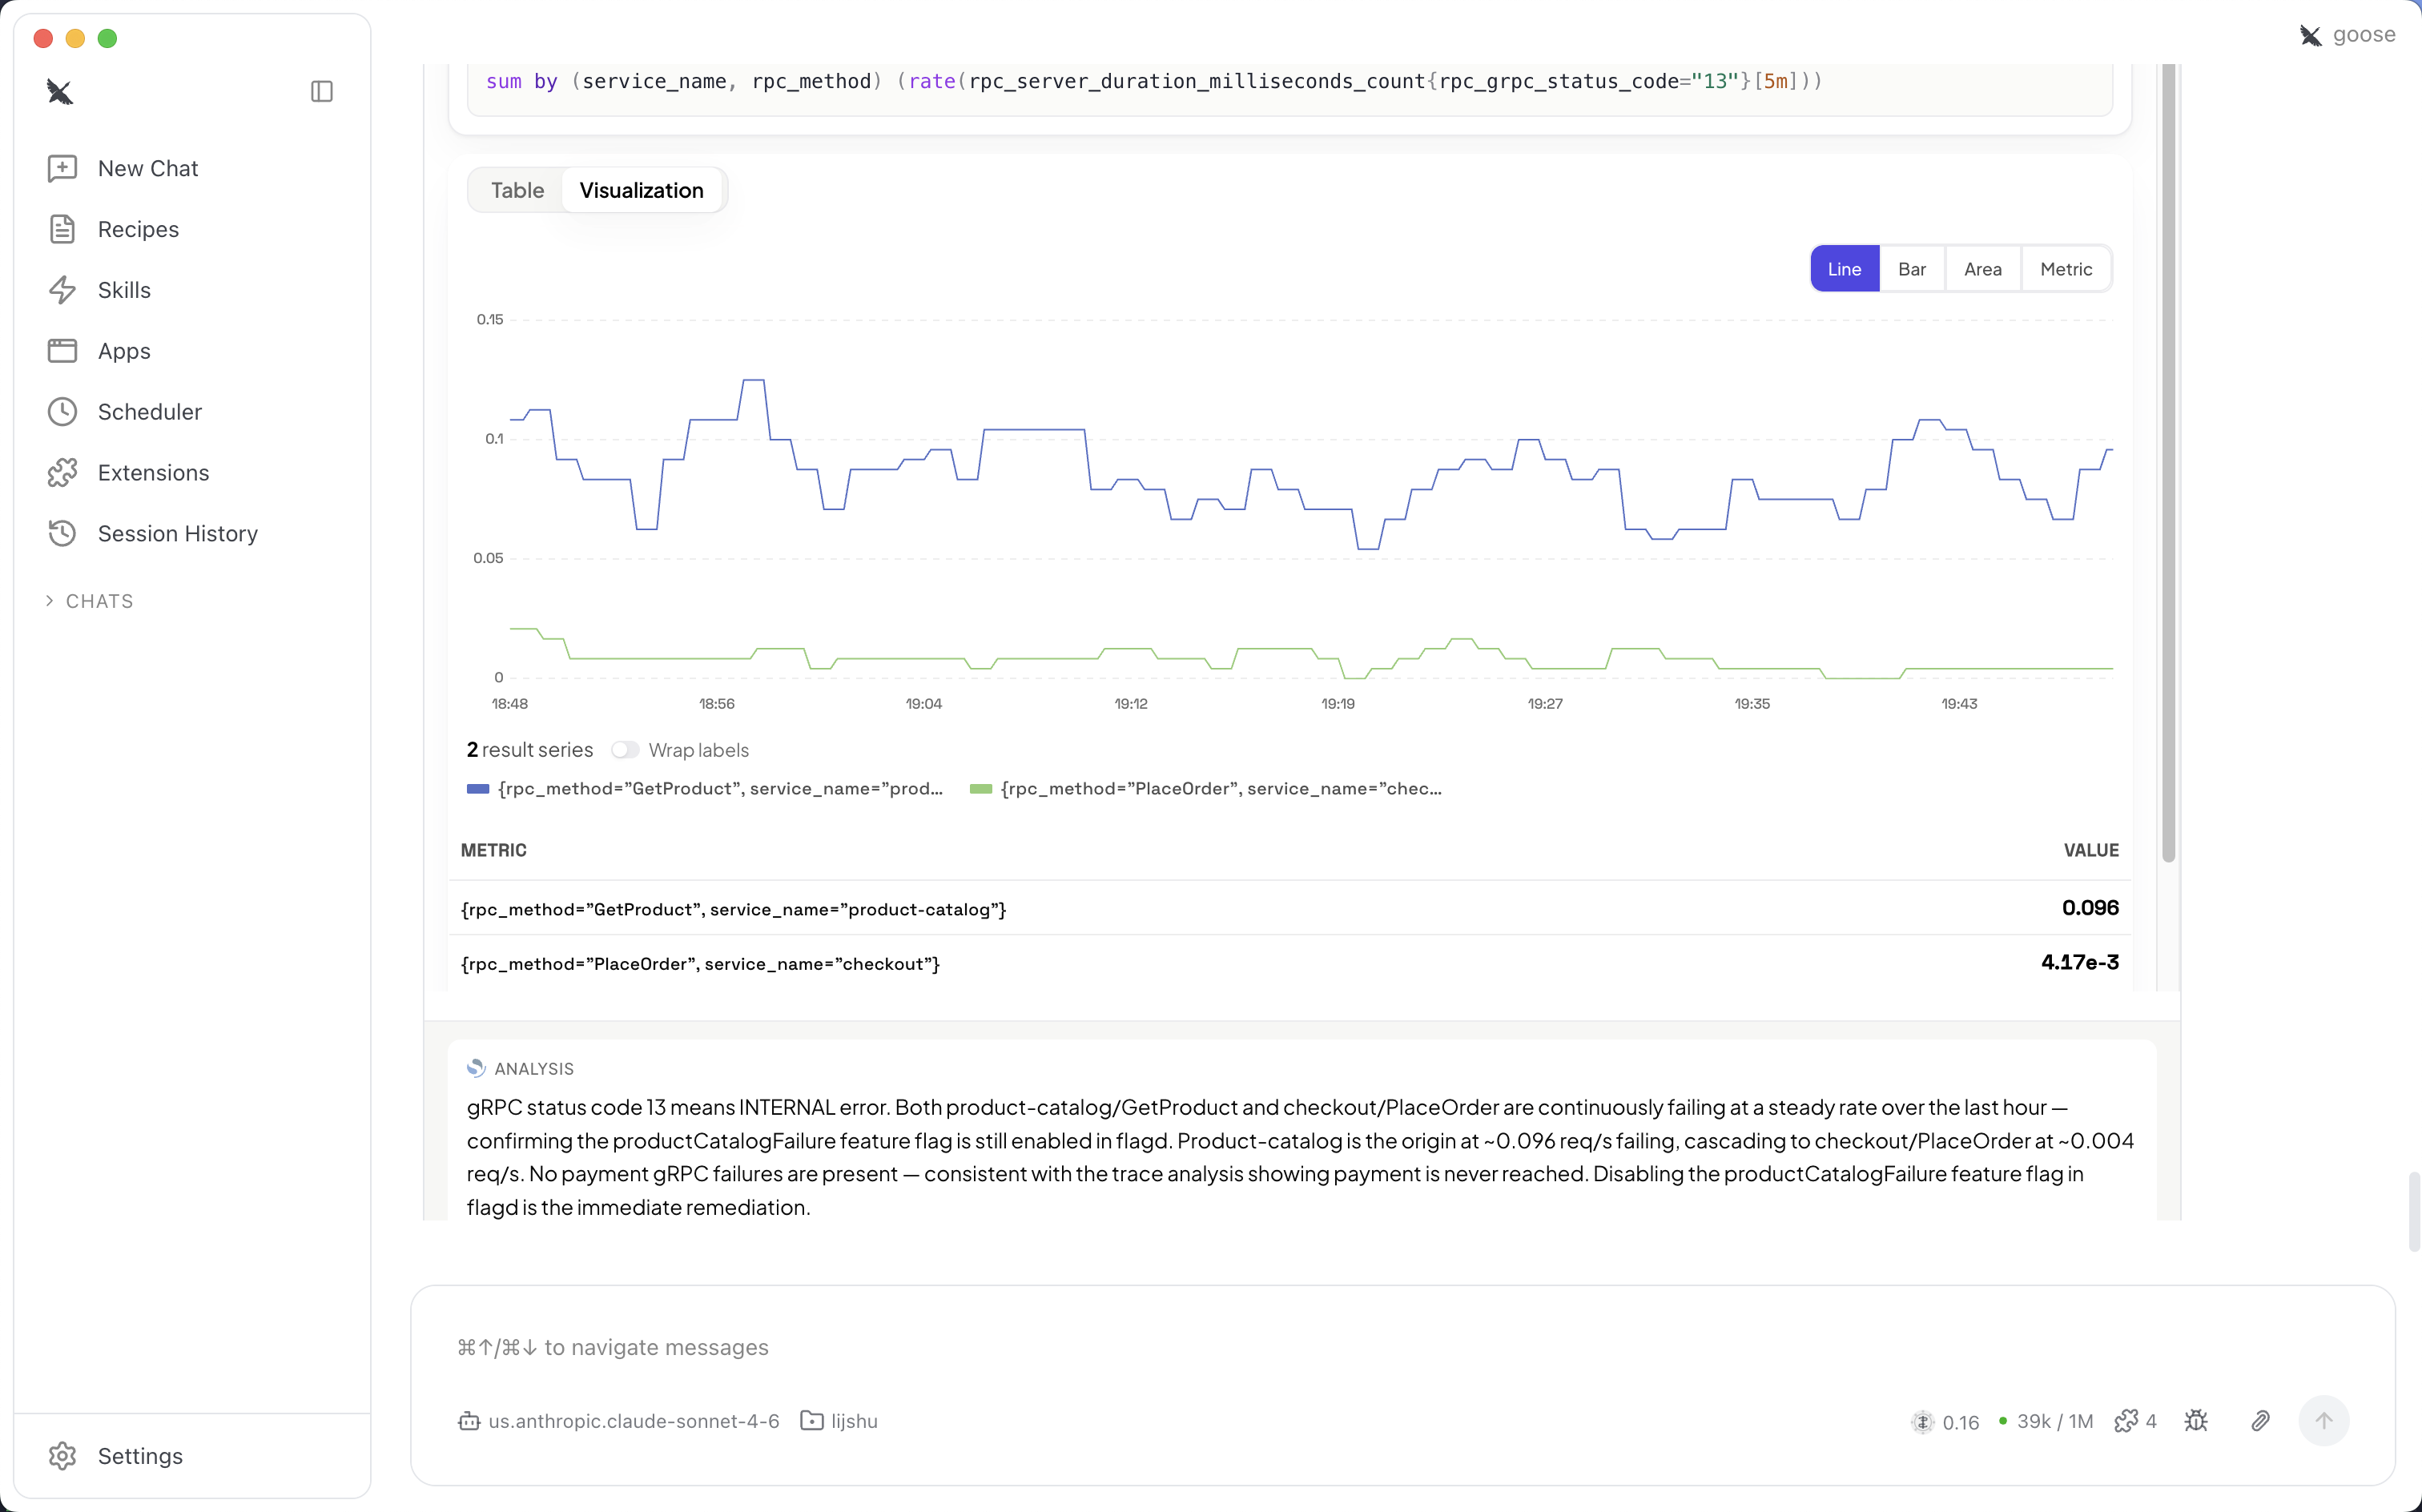
Metric visualization – Render PromQL query results as interactive line, bar, area, or metric charts, with result series and an analysis of the metric behavior. The following screenshot shows the metric visualization.
Key concepts
- OpenSearch UI
-
OpenSearch UI is a managed, cloud-based dashboard and operational analytics experience for Amazon OpenSearch Service. It provides a unified, single-endpoint interface to explore, query, and visualize data across multiple data sources. Visualizations generated through MCP Apps come from your OpenSearch UI application.
- Local MCP server
-
A local MCP server is a program running directly on your computer that acts as a secure, two-way bridge between your agentic IDE and your OpenSearch UI application. The MCP server contains multiple tools that your AI agents can use, including the MCP App tools that render the UI within your compatible IDE. Follow the instructions in the following sections to install a local MCP server with MCP App capabilities.
- MCP App
-
Interactive UI applications that render inside MCP hosts like Claude Desktop. In the OpenSearch agentic observability experience, an MCP app is a composable unit that performs a single observability job such as showing a visualization about SLO or traces.
- Dual response
-
With MCP Apps, a single tool call in your compatible IDE now returns two outputs simultaneously: a compact text summary that you would expect from your observability agent, and an interactive visualization rendered in the same conversation for you to easily review and verify the results.
Prerequisites
-
An OpenSearch UI application with an Observability workspace created and connected to at least one data source (OpenSearch domains, collections, or Amazon Managed Prometheus)
-
An agentic IDE with MCP Apps support
(Claude Desktop, VS Code GitHub Copilot, Goose, ChatGPT, Cursor) -
Basic familiarity with observability concepts (logs, traces, metrics) and IDE usage
-
Node.js 22 or later installed on your local machine
-
AWS credentials configured with permissions to access your OpenSearch UI application. The credentials must allow the
es:ESHttpGetandes:ESHttpPostactions. -
(Optional) The OpenTelemetry Demo application deployed with sample data, if you want to test without production data
Setting up the MCP server
To set up the MCP server using the mcpb file
-
Download
the OpenSearch observability MCP server file. Optionally, you can also download the signature file for verification . -
Unzip the downloaded file.
-
Open the mcpb file to trigger your compatible IDE to start a configuration flow. Follow the instructions within the page.
Alternatively, if opening the mcpb file does not work, you can use the server.js file as reference and manually configure the MCP server in your IDE's extension.
To manually configure the MCP server
-
Open the IDE of your choice (make sure it is compatible with MCP Apps), and navigate to the extensions or MCP section. Choose Add new configuration.
-
In the configuration page, update the following values:
-
Replace the "args" value with your actual server.js file path.
-
Replace OS_UI_ENDPOINT with your OpenSearch UI application's URL.
-
Replace the region with the Region of your OpenSearch UI application.
-
The following example shows a configuration for the MCP server.
{
  "mcpServers": {
    "opensearch-observability-stack-mcp": {
      "command": "node",
      "args": ["/path/to/opensearch-observability-stack-mcp/server/server.js"],
      "env": {
        "OS_UI_ENDPOINT": "application-foo-bar.us-west-2.opensearch.amazonaws.com",
        "AWS_REGION": "us-west-2",
        "AWS_PROFILE": "my-profile"
      }
    }
  }
}
-
/path/to/opensearch-observability-stack-mcp/server/server.js– Replace with the path to your server.js file. -
OS_UI_ENDPOINT– Replace with your OpenSearch UI application URL. -
AWS_REGION– Replace with your AWS Region. -
AWS_PROFILE– Replace with your AWS profile name. If you do not have a profile configured yet, follow this instruction.
After you configure the MCP server, verify the connection by entering a question in your IDE, such as "List available observability data sources". If you receive an error message, follow the instructions to fix the configuration.
Available MCP Apps for agentic observability
-
Triage and Response – alert correlation, incident timeline
-
Log Investigation – pattern search, log clustering
-
Trace Investigation – trace finder, span details, latency breakdown
-
Metric Investigation – PromQL exploration, threshold analysis
-
Service Performance – RED metrics, service-level views
-
Topology – service maps, dependency graphs
-
Visualizations – dynamic visualizations
-
Datasets and Correlations – cross-signal joins, data summaries
-
AI and Agent Observability – LLM call tracing, agent trace map and summary
-
Stack Health – cluster status, shard allocation
-
Instrumentation score
– using telemetry to detect instrumentation pitfalls
mcpb file verification
(Optional) To verify the signature of the downloaded artifact, import the public
signing key
# 1. Import the public signing key (one-time)
curl -s https://d373kuglijqwic.cloudfront.net/opensearch-mcp-signing-public.asc | gpg --import

# 2. Download the artifact and its signature
curl -O https://d373kuglijqwic.cloudfront.net/opensearch-observability-stack-mcp.zip
curl -O https://d373kuglijqwic.cloudfront.net/opensearch-observability-stack-mcp.zip.asc

# 3. Verify
gpg --verify opensearch-observability-stack-mcp.zip.asc opensearch-observability-stack-mcp.zip
If verification succeeds, the output includes Good signature from
"OpenSearch MCP <aos-observability-mcp-releases@amazon.com>".
